Module 10: Introduction to IDS/IPS

These are my notes for Module 10. It covers the three big open-source network detection tools - Suricata, Snort, and Zeek - and it is heavy on the command line and on writing rules. The pattern across all three is the same: run the tool against traffic, read where the evidence lands, and write a rule or filter that pins the malicious behaviour. Most of the work is detecting real C2 and malware (PowerShell Empire, Covenant, Sliver, Ursnif, Cerber, Patchwork, Dridex, Trickbot) from their traffic.
Note on the captures: every PCAP here (
suspicious.pcap,vm-2.pcap,eternalblue.pcap,ursnif.pcap,cerber.pcap,patchwork.pcap,dnsexfil.pcapng,psexec_add_user.pcap, and the rest) comes from the HTB Academy module resources. They are not files you need to find or generate. If you follow along, download them from the module’s resource section.
Back to Module 9: Module 9: Intermediate Network Traffic Analysis
Module 10 Navigation
On this page
Introduction: IDS vs IPS
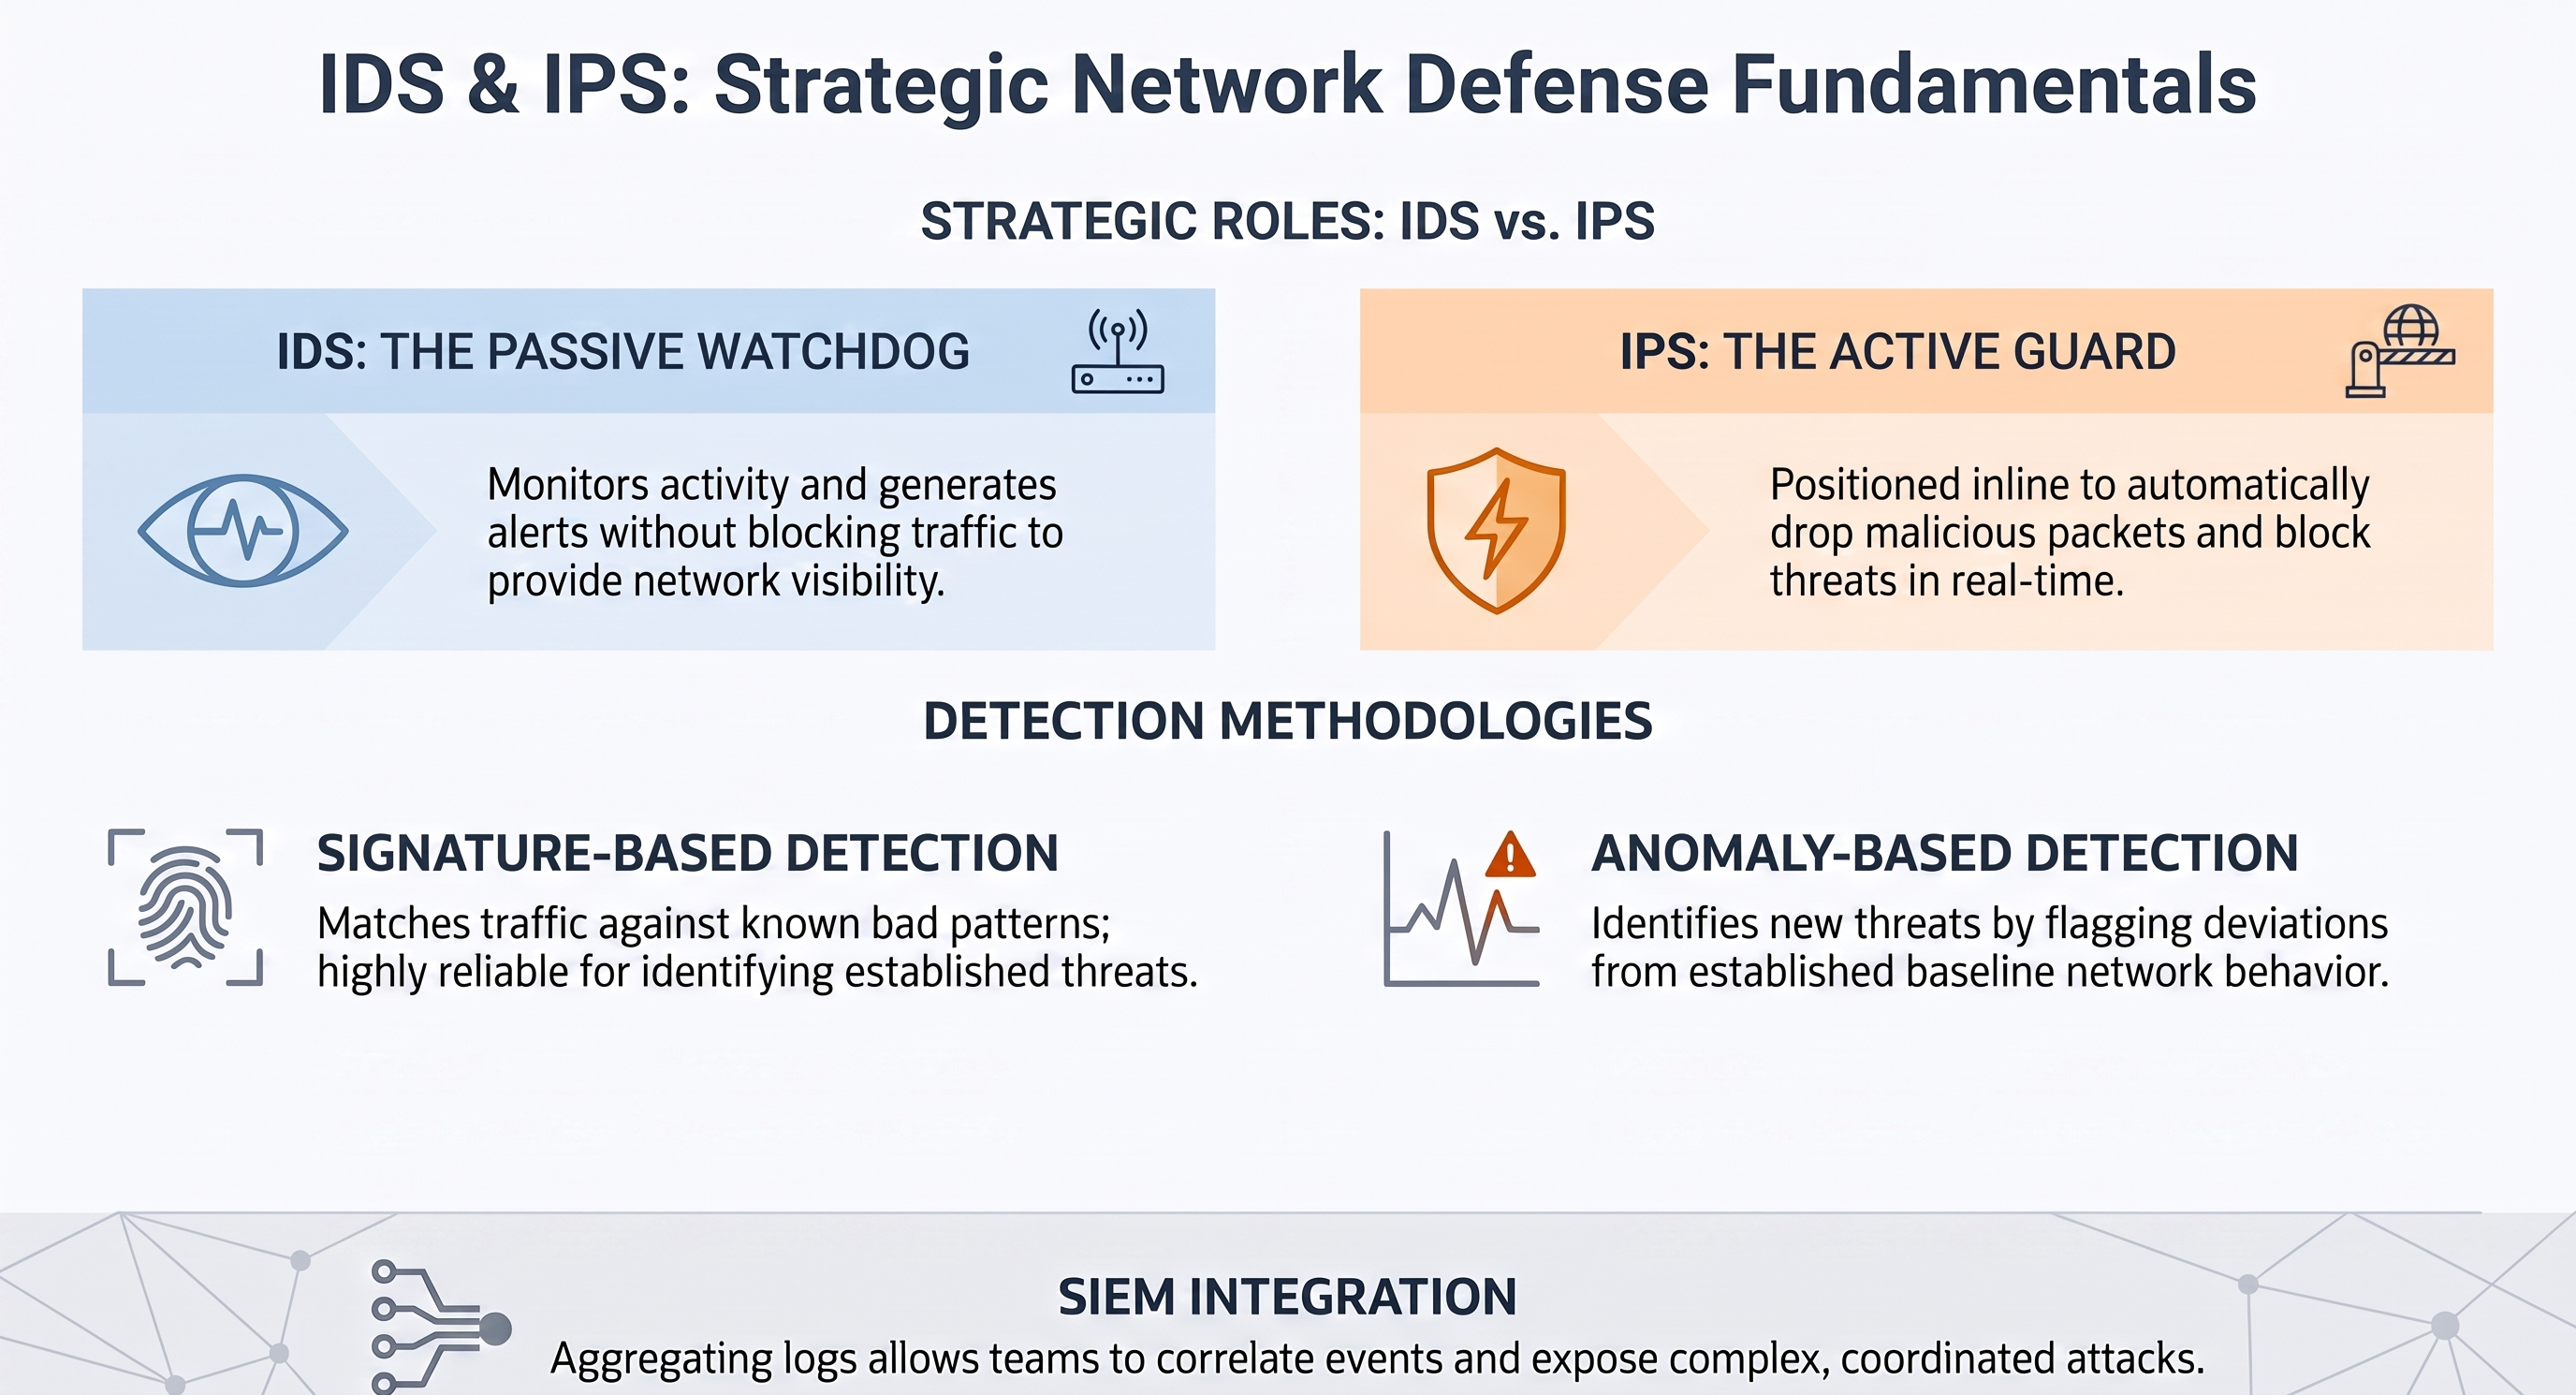
An IDS and an IPS do the same inspection, the difference is what they are allowed to do about it. An IDS is a passive watchdog: it monitors network or host activity, generates alerts, and gives visibility, but it does not stop anything. An IPS sits inline and actively blocks in real time by dropping malicious packets, resetting connections, or blocking traffic.
Both rely on two detection modes. Signature-based detection matches traffic against known bad patterns, which is reliable but limited to threats you already have a signature for. Anomaly-based detection baselines normal behaviour and alerts on deviations, which can catch new threats but is prone to false positives. Most real deployments use both.
They usually sit behind the firewall to examine internal traffic, and host-level variants (HIDS/HIPS) install directly on individual devices. The upkeep is signature updates and anomaly tuning. Feeding IDS/IPS logs into a SIEM is what lets you correlate events and expose coordinated attacks that no single alert would show.
Suricata
Suricata is an open-source network security tool from the Open Information Security Foundation. It inspects traffic from the network layer up to the application layer, and it works on rules: rules tell it what to look for, and when traffic matches, it can alert, log metadata, extract files, or take action depending on the mode.
Operation modes
Suricata runs in four modes. IDS mode observes only, inspecting packets and generating alerts without blocking, which is for visibility and monitoring. IPS mode sits inline so traffic passes through Suricata before reaching the network, and it can allow or block based on rules, though aggressive or untested rules will block legitimate traffic too. IDPS mode is a middle ground: it monitors like IDS but can send TCP RST packets on abnormal or malicious activity, giving limited active response without full inline blocking. NSM mode is purely logging and visibility, recording network activity for later threat hunting, investigation, and forensics.
Inputs
Offline input reads from a saved PCAP with -r:
htb-student@ubuntu:~$ suricata -r /home/htb-student/pcaps/suspicious.pcap
Live input reads straight off an interface, using one of three methods: LibPCAP (reads from an interface but has performance limits), NFQ (Linux inline IPS mode via iptables and NFQUEUE), or AF_PACKET (a faster Linux capture method with multithreading).
Outputs
Suricata writes several output types. The most important is eve.json, a JSON log carrying many event types (alert, http, dns, tls, ssh, flow, drop, smtp, fileinfo, netflow), which is what SIEMs like Splunk and Elastic ingest. fast.log is a simple alert-only log. stats.log is human-readable counters for debugging. Suricata can also emit Unified2, a Snort-style binary alert format read with u2spewfoo.
Configuring rules
Rules live in files, commonly under /etc/suricata/rules/. List them with:
htb-student@ubuntu:~$ ls -lah /etc/suricata/rules/
A rule starting with # is disabled and never loaded. Many rules use $HOME_NET (the internal network) and $EXTERNAL_NET (everything outside it), defined in /etc/suricata/suricata.yaml. In this lab the custom rule file was /home/htb-student/local.rules, loaded from the rule-files section of suricata.yaml, so it did not need moving into the default rules directory. Confirm which files load:
htb-student@ubuntu:~$ sudo grep -n -A20 "^rule-files:" /etc/suricata/suricata.yaml
1945:rule-files:
1946-# - suricata.rules
1947-  - /home/htb-student/local.rules

classification-file: /etc/suricata/classification.config
reference-config-file: /etc/suricata/reference.config
# threshold-file: /etc/suricata/threshold.config
So Suricata loads /home/htb-student/local.rules, alongside the classification, reference, and threshold config files.
Running Suricata
Against a PCAP, offline:
htb-student@ubuntu:~$ suricata -r /home/htb-student/pcaps/suspicious.pcap
<Notice> - This is Suricata version 6.0.13 RELEASE running in USER mode
<Notice> - Signal Received.  Stopping engine.
<Notice> - Pcap-file module read 1 files, 5172 packets, 3941260 bytes
Signal Received. Stopping engine. is normal here, it just means Suricata finished reading the file (5172 packets, 3941260 bytes). Two flags matter for lab PCAPs: -k none bypasses checksum validation (PCAPs often have checksum issues from capture offloading) and -l . writes logs to the current directory:
htb-student@ubuntu:~$ suricata -r /home/htb-student/pcaps/suspicious.pcap -k none -l .
For live LibPCAP capture with verbose output:
htb-student@ubuntu:~$ sudo suricata --pcap=ens160 -vv
For inline IPS-style analysis, send forwarded packets to NFQUEUE with iptables, then read that queue. In this mode Suricata can allow or drop:
htb-student@ubuntu:~$ sudo iptables -I FORWARD -j NFQUEUE
htb-student@ubuntu:~$ sudo suricata -q 0
For IDS mode with AF_PACKET, preferred on Linux for performance and multithreading:
htb-student@ubuntu:~$ sudo suricata -i ens160
htb-student@ubuntu:~$ sudo suricata --af-packet=ens160
And to make a saved PCAP look like live traffic, replay it onto the interface with tcpreplay while Suricata watches:
htb-student@ubuntu:~$ sudo tcpreplay -i ens160 /home/htb-student/pcaps/suspicious.pcap
Actual: 734 packets (664084 bytes) sent in 71.08 seconds
Successful packets:        733
Failed packets:            0
Truncated packets:         0
Analysing output with jq
eve.json is JSON, so jq is the right tool to slice it. To see only alerts:
htb-student@ubuntu:~$ cat /var/log/suricata/old_eve.json | jq -c 'select(.event_type == "alert")'
{"timestamp":"2023-07-06T08:34:35...","flow_id":1959965318909019,"event_type":"alert","src_ip":"10.9.24.101","src_port":51833,"dest_ip":"10.9.24.1","dest_port":53,"proto":"UDP","alert":{"signature_id":1,"signature":"Known bad DNS lookup, possible Dridex infection","severity":3},"dns":{"query":[{"rrname":"adv.epostoday.uk","rrtype":"A","tx_id":0}]},"app_proto":"dns"}
The alert is Known bad DNS lookup, possible Dridex infection on the DNS query adv.epostoday.uk, from 10.9.24.101 to 10.9.24.1:53. To pull the first DNS event and read it whole:
htb-student@ubuntu:~$ cat /var/log/suricata/old_eve.json | jq -c 'select(.event_type == "dns")' | head -1 | jq .
{
  "timestamp": "2023-07-06T08:34:35.003163+0000",
  "flow_id": 1959965318909019,
  "src_ip": "10.9.24.101",
  "dest_ip": "10.9.24.1",
  "dest_port": 53,
  "dns": { "type": "query", "id": 6430, "rrname": "adv.epostoday.uk", "rrtype": "A", "tx_id": 0 }
}
Two fields tie events together: flow_id groups events belonging to the same network flow (one flow can produce DNS metadata, HTTP metadata, fileinfo, and alerts all at once), and pcap_cnt is the packet’s position in the PCAP sequence.
HTTP log output
For focused HTTP visibility, enable http-log in suricata.yaml with a sed one-liner, then confirm it:
htb-student@ubuntu:~$ sudo sed -i '/^[[:space:]]*- http-log:/,/^[[:space:]]*- / s/enabled: no/enabled: yes/' /etc/suricata/suricata.yaml
htb-student@ubuntu:~$ sudo grep -n -A8 "^[[:space:]]*-[[:space:]]*http-log:" /etc/suricata/suricata.yaml
307:  - http-log:
308-      enabled: yes
309-      filename: http.log
310-      append: yes
Run Suricata against the PCAP with the config, then grep the resulting http.log for PHP pages:
htb-student@ubuntu:~$ sudo suricata -r /home/htb-student/pcaps/suspicious.pcap -c /etc/suricata/suricata.yaml
htb-student@ubuntu:~$ grep -i "\.php" http.log
adv.epostoday.uk[**]/app.php[**]Mozilla/5.0 (Windows NT 10.0; Win64; x64) ... Edg/85.0.564.63[**]10.9.24.101:60511 -> 192.185.57.242:80
The requested PHP page is app.php, served from adv.epostoday.uk (10.9.24.101 to 192.185.57.242:80), with an Edge/Chrome user agent.
File extraction
File extraction does not happen just because file-store is enabled. Suricata needs two things: file-store enabled in suricata.yaml, and a rule that uses the filestore keyword. Enable file storage (backing up the config first), then confirm:
htb-student@ubuntu:~$ sudo cp /etc/suricata/suricata.yaml /etc/suricata/suricata.yaml.bak && \
> sudo perl -0pi -e 's/(- file-store:\n\s+version:\s+2\n\s+enabled:\s*)no/${1}yes/s; s/(\n\s*)#(force-filestore:\s*yes)/$1$2/s' /etc/suricata/suricata.yaml && \
> sudo grep -n -A25 "^[[:space:]]*-[[:space:]]*file-store:" /etc/suricata/suricata.yaml
448:  - file-store:
449-      version: 2
450-      enabled: yes
461-      # Force storing of all files. Default: no.
462-      force-filestore: yes
The two settings that matter are enabled: yes and force-filestore: yes. Validate the config, then add the filestore rule to local.rules and confirm it:
htb-student@ubuntu:~$ sudo suricata -T -c /etc/suricata/suricata.yaml
htb-student@ubuntu:~$
htb-student@ubuntu:~$ echo 'alert http any any -> any any (msg:"FILE store all"; filestore; sid:2; rev:1;)' | sudo tee -a /home/htb-student/local.rules
htb-student@ubuntu:~$ tail -n 5 /home/htb-student/local.rules
#alert tls any any -> any any (msg:"Trickbot C2 SSL"; ja3.hash; content:""; sid:100299; rev:1;)

alert http any any -> any any (msg:"FILE store all"; filestore; sid:2; rev:1;)
Run Suricata against vm-2.pcap, then list the directory:
htb-student@ubuntu:~$ suricata -r /home/htb-student/pcaps/vm-2.pcap
<Notice> - Pcap-file module read 1 files, 803 packets, 683915 bytes
htb-student@ubuntu:~$ dir
eve.json  fast.log  filestore  local.rules  pcaps  stats.log  suricata.log
The new filestore directory is the proof extraction worked. Suricata names each extracted file by the SHA256 of its contents and drops it in a folder named after the first two characters of that hash:
htb-student@ubuntu:~$ find . -type f
./fb/fb20d18d00c806deafe14859052072aecfb9f46be6210acfce80289740f2e20e
./21/214306c98a3483048d6a69eec6bf3b50497363bc2c98ed3cd954203ec52455e5
./21/21742fc621f83041db2e47b0899f5aea6caa00a4b67dbff0aae823e6817c5433
./26/2694f69c4abf2471e09f6263f66eb675a0ca6ce58050647dcdcfebaf69f11ff4
./2c/2ca1a0cd9d8727279f0ba99fd051e1c0acd621448ad4362e1c9fc78700015228
./7d/7d4c00f96f38e0ffd89bc2d69005c4212ef577354cc97d632a09f51b2d37f877
./6b/6b7fee8a4b813b6405361db2e70a4f5a213b34875dd2793667519117d8ca0e4e
./2e/2e2cb2cac099f08bc51abba263d9e3f8ac7176b54039cc30bbd4a45cfa769018
./50/508c47dd306da3084475faae17b3acd5ff2700d2cd85d71428cdfaae28c9fd41
./c2/c210f737f55716a089a33daf42658afe771cfb43228ffa405d338555a9918815
./ea/ea0936257b8d96ee6ae443adee0f3dacc3eff72b559cd5ee3f9d6763cf5ee2ab
./1a/1aab7d9c153887dfa63853534f684e5d46ecd17ba60cd3d61050f7f231c4babb
./c4/c4775e980c97b162fd15e0010663694c4e09f049ff701d9671e1578958388b9f
./63/63de4512dfbd0087f929b0e070cc90d534d6baabf2cdfbeaf76bee24ff9b1638
./48/482d9972c2152ca96616dc23bbaace55804c9d52f5d8b253b617919bb773d3bb
./8e/8ea3146c676ba436c0392c3ec26ee744155af4e4eca65f4e99ec68574a747a14
./8e/8e23160cc504b4551a94943e677f6985fa331659a1ba58ef01afb76574d2ad7c
./a5/a52dac473b33c22112a6f53c6a625f39fe0d6642eb436e5d125342a24de44581
Inspecting one with xxd shows the headers, which is the payoff:
htb-student@ubuntu:~$ xxd ./21/21742fc621f83041db2e47b0899f5aea6caa00a4b67dbff0aae823e6817c5433 | head
00000000: 4d5a 9000 0300 0000 0400 0000 ffff 0000  MZ..............
00000010: b800 0000 0000 0000 4000 0000 e907 0000  ........@.......
00000020: 0000 0000 0000 0000 0000 0000 0000 0000  ................
00000030: 0000 0000 0000 0000 0000 0000 8000 0000  ................
00000040: 0e1f ba0e 00b4 09cd 21b8 014c cd21 5468  ........!..L.!Th
00000050: 6973 2070 726f 6772 616d 2063 616e 6e6f  is program canno
00000060: 7420 6265 2072 756e 2069 6e20 444f 5320  t be run in DOS
00000070: 6d6f 6465 2e0d 0d0a 2400 0000 0000 0000  mode....$.......
00000080: 5045 0000 4c01 0300 fc90 8448 0000 0000  PE..L......H....
00000090: 0000 0000 e000 0f01 0b01 0600 00d0 0000  ................
MZ is the Windows executable header and PE is the Portable Executable format, so the extracted file is a Windows executable, confirming the PCAP carried a transferred .exe or .dll.
Reloading and updating rules
Live rule reload lets you apply rule changes without stopping capture. The setting is detect-engine: reload: true in suricata.yaml. In my lab the section was not present, so I appended it:
htb-student@ubuntu:~$ printf '\n# Custom detect engine reload setting\ndetect-engine:\n - reload: true\n' | sudo tee -a /etc/suricata/suricata.yaml
Then send Suricata the USR2 signal to reload the ruleset without a restart:
htb-student@ubuntu:~$ sudo kill -usr2 $(pidof suricata)
Rules themselves are updated with suricata-update, which pulls from enabled providers and writes to /var/lib/suricata/rules/. List providers and enable one:
htb-student@ubuntu:~$ sudo suricata-update list-sources
Name: et/open
  Vendor: Proofpoint
  Summary: Emerging Threats Open Ruleset
  License: MIT
Name: et/pro
  Vendor: Proofpoint
  Replaces: et/open
  Subscription: https://www.proofpoint.com/us/threat-insight/et-pro-ruleset
Name: oisf/trafficid
  Vendor: OISF
htb-student@ubuntu:~$ sudo suricata-update enable-source et/open
htb-student@ubuntu:~$ sudo suricata-update
htb-student@ubuntu:~$ sudo systemctl restart suricata
After any config or rule change, validate before trusting it:
htb-student@ubuntu:~$ sudo suricata -T -c /etc/suricata/suricata.yaml
A Configuration provided was successfully loaded line means it is valid.
Lab answers
Filtering HTTP events for their flow_id:
htb-student@ubuntu:~$ sudo jq -r 'select(.event_type=="http") | .flow_id' /var/log/suricata/old_eve.json | sort | uniq -c
      3 1252204100696793
The flow_id is 1252204100696793. And enabling http-log then running against suspicious.pcap gives the requested PHP page app.php.
Suricata Rule Development
A rule tells the engine what to look for, and when traffic matches, it alerts, logs, drops, passes, or rejects depending on the action and mode. Rules are not only for malware, they also build visibility (unusual traffic, suspicious headers, repeated patterns). The balance to strike is specific enough to keep false positives down, but not so narrow that variations slip through.
A rule has a header, rule options, and metadata. The general shape is:
action protocol from_ip port -> to_ip port (msg:"Known malicious behavior"; content:"some thing"; sid:10000001; rev:1;)
The header is action protocol source_ip source_port direction destination_ip destination_port, for example alert http $HOME_NET any -> $EXTERNAL_NET any. The pieces:
- Actions:
alert(alert on match),log(log without alerting),pass(ignore),drop(drop the packet in IPS mode),reject(reject, usually with a TCP RST). Most lab examples usealert. - Protocols:
tcp,udp,icmp,ip,http,tls,smb,dns. - Direction:
->is one-way,<>is bidirectional. - Ports: a single port (
9443), a variable ($UNCOMMON_PORTS), or a list like[8443,8080,7001:7002,!8443](8443 and 8080, the range 7001 to 7002, excluding 8443).
The rule options are where detection happens:
msgis the alert text and should say what the rule detects.contentmatches a string or byte pattern. Hex goes inside pipes, so|3a 20|is:and|0d 0a|is the CRLF that ends an HTTP header line. Hex escapes are needed because a bare:or;would end the rule option.- Sticky buffers tell Suricata where to look instead of the whole packet:
http_method,http_uri,http_cookie,http_user_agent. Content is what to match, the buffer is where. flowdescribes connection state and direction, for exampleflow:established,to_server(an established TCP session, client to server).dsizematches the payload size, not the full packet, sodsize:312triggers only on a 312-byte TCP payload.nocasemakes a match case-insensitive.offsetanddepthset where to start and how far to look, sooffset:0; depth:5;searches only the first 5 bytes.distanceandwithinare for multiple content matches:distanceis how far after the previous match to start,withinlimits how far to search from there.detection_filtertriggers on frequency, sotrack by_src, count 4, seconds 10alerts only when a source hits four times in ten seconds.pcreis a Perl-compatible regex for whencontentis not enough. Use content matches first and PCRE to refine, for performance.- Metadata covers
sid,rev,reference,classtype, andpriority.fast_patternmarks which content Suricata uses as the efficient prefilter anchor.
To see which rules are active versus commented:
htb-student@ubuntu:~$ grep -n '^[[:space:]]*alert' /home/htb-student/local.rules
htb-student@ubuntu:~$ grep -n '^[[:space:]]*#alert' /home/htb-student/local.rules
Testing a rule is always the same loop: uncomment it, run Suricata against the correct PCAP, and check fast.log. An empty fast.log means the rule is commented, did not match, or the wrong PCAP was used.
htb-student@ubuntu:~$ sudo suricata -r /home/htb-student/pcaps/file.pcap -l . -k none
htb-student@ubuntu:~$ cat fast.log
C2 detection examples
PowerShell Empire
PowerShell Empire over HTTP is caught with a layered rule combining method, URI, cookie, user agent, and absent headers:
alert http $HOME_NET any -> $EXTERNAL_NET any (msg:"ET MALWARE Possible PowerShell Empire Activity Outbound"; flow:established,to_server; content:"GET"; http_method; content:"/"; http_uri; depth:1; pcre:"/^(?:login\/process|admin\/get|news)\.php$/RU"; content:"session="; http_cookie; pcre:"/^(?:[A-Z0-9+/]{4})*(?:[A-Z0-9+/]{2}==|[A-Z0-9+/]{3}=|[A-Z0-9+/]{4})$/CRi"; content:"Mozilla|2f|5.0|20 28|Windows|20|NT|20|6.1"; http_user_agent; http_start; content:".php|20|HTTP|2f|1.1|0d 0a|Cookie|3a 20|session="; fast_pattern; http_header_names; content:!"Referer"; content:!"Cache"; content:!"Accept"; sid:2027512; rev:1;)
It fires on an internal host making an established GET to login/process.php, admin/get.php, or news.php, with a Base64-looking session= cookie, a Mozilla/5.0 Windows NT 6.1 user agent, and no Referer, Cache, or Accept headers. Run and check:
htb-student@ubuntu:~$ sudo suricata -r /home/htb-student/pcaps/psempire.pcap -l . -k none
htb-student@ubuntu:~$ cat fast.log
The alert is ET MALWARE Possible PowerShell Empire Activity Outbound.
Covenant
Covenant gives two angles. By body content, matching the literal HTTP body string only when a source repeats it four times in ten seconds:
alert tcp any any -> $HOME_NET any (msg:"detected by body"; content:"<title>Hello World!</title>"; detection_filter: track by_src, count 4 , seconds 10; priority:1; sid:3000011;)
htb-student@ubuntu:~$ sudo suricata -r /home/htb-student/pcaps/covenant.pcap -l . -k none
htb-student@ubuntu:~$ cat fast.log
And by size and counter, which is behaviour-based rather than content-based - it does not look for a malware string, it looks for a payload of exactly 312 bytes repeated three times in ten seconds:
alert tcp $HOME_NET any -> any any (msg:"detected by size and counter"; dsize:312; detection_filter: track by_src, count 3 , seconds 10; priority:1; sid:3000001;)
Sliver
Sliver is caught on its POST URI pattern:
alert tcp any any -> any any (msg:"Sliver C2 Implant Detected"; content:"POST"; pcre:"/\/(php|api|upload|actions|rest|v1|oauth2callback|authenticate|oauth2|oauth|auth|database|db|namespaces)(.*?)((login|signin|api|samples|rpc|index|admin|register|sign-up)\.php)\?[a-z_]{1,2}=[a-z0-9]{1,10}/i"; sid:1000007; rev:1;)
htb-student@ubuntu:~$ sudo suricata -r /home/htb-student/pcaps/sliver.pcap -l . -k none
htb-student@ubuntu:~$ cat fast.log
And on its cookie pattern, where the cookie value is 32 lowercase alphanumeric characters:
alert tcp any any -> any any (msg:"Sliver C2 Implant Detected - Cookie"; content:"Set-Cookie"; pcre:"/(PHPSESSID|SID|SSID|APISID|csrf-state|AWSALBCORS)\=[a-z0-9]{32}\;/"; sid:1000003; rev:1;)
Those three examples map onto the three rule-writing approaches: signature-based (known strings, headers, URIs, cookies - good for known threats, misses variants when the string changes), behaviour-based (size, timing, frequency like the Covenant size rule - survives string changes but risks more false positives), and stateful protocol analysis (does the traffic behave like real HTTP, is the connection established, which direction - which reduces false positives). A good rule usually combines direction, protocol, flow, content, sticky buffers, frequency, and metadata.
Assessment: MS17-010 offset
The rule with sid:2024217 (ETERNALBLUE MS17-010) needed the minimum offset value that still triggers against eternalblue.pcap. I brute-forced it: for each offset from 0 to 20, rewrite the rule, clear the old logs, run Suricata, and stop at the first offset that produces an alert.
htb-student@ubuntu:~$ for i in $(seq 0 20); do
htb-student@ubuntu:~$   sudo sed -i -E "/sid:2024217/s/offset:[0-9]+;/offset:$i;/" /home/htb-student/local.rules
htb-student@ubuntu:~$   rm -f fast.log eve.json stats.log suricata.log
htb-student@ubuntu:~$   sudo suricata -r /home/htb-student/pcaps/eternalblue.pcap -l . -k none >/dev/null 2>&1
htb-student@ubuntu:~$   if grep -q "2024217" fast.log 2>/dev/null; then
htb-student@ubuntu:~$     echo "Minimum offset that triggers: $i"; cat fast.log; break
htb-student@ubuntu:~$   fi
htb-student@ubuntu:~$ done
Minimum offset that triggers: 4
05/18/2017-01:12:13.428436  [**] [1:2024217:3] ETERNALBLUE MS17-010 [**] [Classification: (null)] [Priority: 3] {TCP} 192.168.116.149:49472 -> 192.168.116.138:445
05/18/2017-01:13:02.536176  [**] [1:2024217:3] ETERNALBLUE MS17-010 [**] [Classification: (null)] [Priority: 3] {TCP} 192.168.116.149:50742 -> 192.168.116.172:445
05/18/2017-01:13:22.563076  [**] [1:2024217:3] ETERNALBLUE MS17-010 [**] [Classification: (null)] [Priority: 3] {TCP} 192.168.116.149:51495 -> 192.168.116.172:445
05/18/2017-01:13:30.914548  [**] [1:2024217:3] ETERNALBLUE MS17-010 [**] [Classification: (null)] [Priority: 3] {TCP} 192.168.116.138:1440 -> 192.168.116.172:445
The minimum offset that triggers is 4, with 192.168.116.149 scanning .138 and .172 on port 445.

Suricata: Encrypted Traffic (TLS and JA3)
Encrypted traffic hides the content, but the TLS handshake and certificate metadata are still in the clear, so Suricata is not blind to it. Two signals work: TLS certificate patterns and JA3 fingerprints.
Dridex (TLS certificate)
Dridex is detected on suspicious TLS certificate structure. The rule (sid:2023476, ET MALWARE ABUSE.CH SSL Blacklist Malicious SSL certificate detected (Dridex)) checks certificate byte patterns against the known-bad fields. The certificate field OIDs matter here: 55 04 06 is countryName, 55 04 07 is localityName, 55 04 0a is organizationName, and 55 04 03 is commonName.
htb-student@ubuntu:~$ sudo suricata -r /home/htb-student/pcaps/dridex.pcap -l . -k none
htb-student@ubuntu:~$ cat fast.log
The Dridex SSL certificate alert appears in fast.log.
JA3 fingerprints (Sliver)
JA3 is a fingerprint of how a TLS client starts a connection, hashed from the Client Hello, and it is useful because a malware family or C2 tool often produces a consistent JA3. The Sliver JA3 from the course is 473cd7cb9faa642487833865d516e578:
alert tls any any -> any any (msg:"Sliver C2 SSL"; ja3.hash; content:"473cd7cb9faa642487833865d516e578"; sid:1002; rev:1;)
On the lab box this errored with unknown rule keyword 'ja3.hash'. The older Suricata build wanted ja3_hash instead of ja3.hash, so the working rule was:
alert tls any any -> any any (msg:"Sliver C2 SSL"; ja3_hash; content:"473cd7cb9faa642487833865d516e578"; sid:1002; rev:1;)
htb-student@ubuntu:~$ sudo suricata -T -c /etc/suricata/suricata.yaml
htb-student@ubuntu:~$ sudo suricata -r /home/htb-student/pcaps/sliverenc.pcap -l . -k none
htb-student@ubuntu:~$ cat fast.log
Worth remembering: if a course rule uses ja3.hash and Suricata errors, try ja3_hash on older versions.
Assessment: Trickbot JA3
For the assessment, I extracted the JA3 hashes from trickbot.pcap and tested each in the rule (sid:100299) until one alerted:
htb-student@ubuntu:~$ ja3 -a --json /home/htb-student/pcaps/trickbot.pcap | jq -r '.[].ja3_digest' | sort | uniq -c
      2 3b5074b1b5d032e5620f69f9f700ff0e
     95 72a589da586844d7f0818ce684948eea
Putting each into the rule and running against the PCAP, the first did not trigger and the second raised the Trickbot alert. The answer is 72a589da586844d7f0818ce684948eea.
Snort
Snort is an open-source IDS/IPS that also runs as a packet logger or sniffer, and it needs rule sets to know what to look for.
It has a few operation modes: inline IDS/IPS, passive IDS, network-based IDS, and host-based IDS (which works but is not what Snort is for). Passive means watch and alert but cannot block, inline means it sits in the path and can drop. The mode is inferred from flags: -r (pcap) and -i (interface) default to passive, and you add -Q for inline, only if the DAQ supports it (afpacket does).
The architecture is a pipeline: sniffer/decoder pulls traffic and parses packet structure, preprocessors classify traffic type or behaviour (the HTTP plugin, port_scan, and others, configured in snort.lua), the detection engine matches packets against rules, and logging/alerting plus output modules record or alert per rule action.
Configuration
The main config is snort.lua, with external defaults in snort_defaults.lua:
htb-student@ubuntu:~$ sudo more /root/snorty/etc/snort/snort.lua
The header comments lay out eight config stages: defaults, inspection, bindings, performance, detection, filters, outputs, tweaks. HOME_NET and EXTERNAL_NET both default to any, and you usually leave EXTERNAL_NET as any.
Snort has 200+ modules, each tagged by type (logger, inspector, ips_option, codec, basic, policy_selector) and configured as Lua tables where an empty table means built-in defaults. List them or a module’s settings:
htb-student@ubuntu:~$ snort --help-modules
htb-student@ubuntu:~$ snort --help-config arp_spoof
Validate the whole config:
htb-student@ubuntu:~$ sudo snort -c /root/snorty/etc/snort/snort.lua --daq-dir /usr/local/lib/daq
It ends with Snort successfully validated the configuration (with 0 warnings). The --daq-dir is not needed just to validate, it is included to match the target box. LibDAQ (the Data Acquisition Library) is the abstraction layer between Snort’s modules and the network data source, and the DAQ module also decides whether inline is available.
Inputs are a pcap file with -r or a live interface with -i:
htb-student@ubuntu:~$ sudo snort -c /root/snorty/etc/snort/snort.lua --daq-dir /usr/local/lib/daq -r /home/htb-student/pcaps/icmp.pcap
htb-student@ubuntu:~$ sudo snort -c /root/snorty/etc/snort/snort.lua --daq-dir /usr/local/lib/daq -i ens160
Rules look like Suricata rules but are not identical, so read the Snort docs rather than assuming Suricata knowledge carries over. Rules load via the ips module in snort.lua:
ips =
{
    --enable_builtin_rules = true,
    { variables = default_variables, include = '/home/htb-student/local.rules' }
}
Or from the command line with -R <file> for a single file or --rule-path <dir> for a directory:
htb-student@ubuntu:~$ sudo snort -c /root/snorty/etc/snort/snort.lua --daq-dir /usr/local/lib/daq \
>   -r /home/htb-student/pcaps/icmp.pcap -R /home/htb-student/local.rules -A cmg
Outputs
Basic statistics print on shutdown (packet, module, file, and summary stats, where a peg count is a counter for how often something was seen). Rules do nothing visible without -A: -A cmg is alert plus headers plus payload (equivalent to -A fast -d -e), -A u2 is binary unified2 for post-processing, and -A csv is comma-separated fields. The logger plugins:
htb-student@ubuntu:~$ snort --list-plugins | grep logger
logger::alert_csv   logger::alert_fast   logger::alert_full   logger::alert_json
logger::alert_syslog   logger::alert_talos   logger::alert_unixsock
logger::log_codecs   logger::log_hext   logger::log_pcap   logger::unified2
Reading a cmg alert:
06/19-08:45:56 [**] [1:1000001:1] "ICMP test" [**] [Classification: Generic ICMP event] [Priority: 3] {ICMP} 192.168.158.139 -> 174.137.42.77
00:0C:29:34:0B:DE -> 00:50:56:E0:14:49 type:0x800 len:0x4A
192.168.158.139 -> 174.137.42.77 ICMP TTL:128 TOS:0x0 ID:55107 IpLen:20 DgmLen:60
Type:8  Code:0  ID:512   Seq:8448  ECHO
[1:1000001:1] is GID:SID:Revision, the quoted string is the rule msg, Classification and Priority come from the rule’s classtype, and the lines below are the ethernet, IP, and ICMP headers then the payload.
Assessment: wannamine
For the fundamentals assessment, running Snort against wannamine.pcap and counting how many times sid 1000001 triggered gives 234. The catch is that local.rules is already included in snort.lua, so passing it again with -R loads it twice and doubles the count:
htb-student@ubuntu:~$ sudo grep -n "local.rules" /root/snorty/etc/snort/snort.lua
htb-student@ubuntu:~$ sudo snort -c /root/snorty/etc/snort/snort.lua --daq-dir /usr/local/lib/daq \
>   -r /home/htb-student/pcaps/wannamine.pcap -A fast 2>/dev/null | grep -c "1:1000001:"
234
Snort Rule Development
Ursnif
Ursnif is the lesson in how a constraint can silently break a rule. The starting rule is inefficient:
alert tcp any any -> any any (msg:"Possible Ursnif C2 Activity";
  flow:established,to_server;
  content:"/images/", depth 12;
  content:"_2F"; content:"_2B";
  content:"User-Agent|3a 20|Mozilla/4.0 (compatible|3b| MSIE 8.0|3b| Windows NT";
  content:!"Accept"; content:!"Cookie|3a|"; content:!"Referer|3a|";
  sid:1000002; rev:1;)
tcp any any -> any any evaluates against every established TCP flow rather than just HTTP, there are no sticky buffers so content searches the raw payload, and there is no HTTP normalization. The real bug is depth 12: the match must complete within the first 12 bytes, and GET /images/ is exactly 12 while POST /images/ is 13, so the POST match ends one byte outside the window and is missed.
htb-student@ubuntu:~$ sudo snort -c /root/snorty/etc/snort/snort.lua --daq-dir /usr/local/lib/daq \
>   -r /home/htb-student/pcaps/ursnif.pcap -A cmg -q
It fires once, on the GET at 10.10.10.104:49191 -> 192.42.116.41:80, and misses the POST. The raw output is one flat snort.raw dump:
[1:1000002:1] "Possible Ursnif C2 Activity" [Priority: 0] {TCP} 10.10.10.104:49191 -> 192.42.116.41:80
00:1F:E2:10:8B:C9 -> 00:0C:29:C9:67:00 type:0x800 len:0x18C
10.10.10.104:49191 -> 192.42.116.41:80 TCP TTL:128 TOS:0x0 ID:20640 IpLen:20 DgmLen:382 DF
***AP*** Seq: 0x12E06BB  Ack: 0xE061E225  Win: 0x4029  TcpLen: 20

snort.raw[342]:
47 45 54 20 2F 69 6D 61  67 65 73 2F 70 32 52 55  GET /ima ges/p2RU
52 68 5F 32 2F 42 6B 32  76 72 31 4F 59 52 46 31  Rh_2/Bk2 vr1OYRF1
57 47 75 35 6E 67 5F 32  46 73 66 73 2F 57 4F 57  WGu5ng_2 Fsfs/WOW
72 47 54 45 54 79 4B 2F  37 4D 7A 4D 5F 32 42 6E  rGTETyK/ 7MzM_2Bn
47 5A 51 52 32 6A 73 67  50 2F 73 5F 32 42 70 53  GZQR2jsg P/s_2BpS
34 31 4B 37 41 67 2F 4F  75 4A 6A 51 66 41 61 63  41K7Ag/O uJjQfAac
32 64 2F 76 6D 46 5F 32  46 31 4B 42 50 72 4B 5F  2d/vmF_2 F1KBPrK_
32 2F 46 36 36 38 32 64  67 64 69 61 47 31 7A 75  2/F6682d gdiaG1zu
56 43 7A 37 47 68 64 2F  62 4C 37 36 57 66 35 71  VCz7Ghd/ bL76Wf5q
64 71 77 56 35 76 7A 52  2F 32 65 31 41 38 79 42  dqwV5vzR /2e1A8yB
49 64 6B 6D 49 5F 32 42  2F 6F 67 79 7A 4E 55 57  IdkmI_2B /ogyzNUW
33 47 72 2F 67 4B 42 5A  57 58 78 2E 67 69 66 20  3Gr/gKBZ WXx.gif
48 54 54 50 2F 31 2E 31  0D 0A 55 73 65 72 2D 41  HTTP/1.1 ..User-A
67 65 6E 74 3A 20 4D 6F  7A 69 6C 6C 61 2F 34 2E  gent: Mo zilla/4.
30 20 28 63 6F 6D 70 61  74 69 62 6C 65 3B 20 4D  0 (compa tible; M
53 49 45 20 38 2E 30 3B  20 57 69 6E 64 6F 77 73  SIE 8.0;  Windows
20 4E 54 20 36 2E 31 29  0D 0A 48 6F 73 74 3A 20   NT 6.1) ..Host:
62 6C 75 65 77 61 74 65  72 73 74 6F 6E 65 2E 72  bluewate rstone.r
75 0D 0A 43 6F 6E 6E 65  63 74 69 6F 6E 3A 20 4B  u..Conne ction: K
65 65 70 2D 41 6C 69 76  65 0D 0A 43 61 63 68 65  eep-Aliv e..Cache
2D 43 6F 6E 74 72 6F 6C  3A 20 6E 6F 2D 63 61 63  -Control : no-cac
68 65 0D 0A 0D 0A                                 he....
The optimized version anchors on HTTP and uses sticky buffers:
alert http $HOME_NET any -> $EXTERNAL_NET any (
  msg:"Possible Ursnif C2 Activity - Optimized";
  flow:established,to_server;
  http_uri; content:"/images/", depth 8;
  content:"_2F"; content:"_2B";
  http_header;
  content:"User-Agent|3a 20|Mozilla/4.0 (compatible|3b| MSIE 8.0|3b| Windows NT", fast_pattern, nocase;
  content:!"Accept|3a|", nocase; content:!"Cookie|3a|", nocase; content:!"Referer|3a|", nocase;
  classtype:trojan-activity;
  sid:1000003; rev:1;)
Only two changes fix the miss: moving into the http_uri buffer, and depth 8. In http_uri, /images/ is 8 bytes and starts at byte 1 regardless of method, so both GET and POST match. Proof: the original rule with only depth 13 and nothing else changed catches both. Original fires once, optimized fires twice, now catching the POST at 10.10.10.104:49190:
[1:1000003:1] "Possible Ursnif C2 Activity - Optimized" [Classification: A Network Trojan was detected] [Priority: 1] {TCP} 10.10.10.104:49190 -> 192.42.116.41:80

http_inspect.http_method[4]:
50 4F 53 54                                       POST

http_inspect.http_version[8]:
48 54 54 50 2F 31 2E 31                           HTTP/1.1

http_inspect.http_uri[204]:
2F 69 6D 61 67 65 73 2F  38 4E 62 33 63 31 78 46  /images/ 8Nb3c1xF
6E 41 74 45 47 76 37 2F  35 55 38 47 39 6F 4A 69  nAtEGv7/ 5U8G9oJi
67 46 74 63 6D 63 66 4D  54 43 2F 4F 74 35 4B 59  gFtcmcfM TC/Ot5KY
34 5F 32 46 2F 63 54 59  38 35 5A 4E 6C 4F 50 39  4_2F/cTY 85ZNlOP9
4B 4C 6C 50 34 4F 35 6C  43 2F 49 36 7A 34 36 5F  KLlP4O5l C/I6z46_
32 46 56 36 50 42 5A 5F  32 46 36 45 61 2F 48 6C  2FV6PBZ_ 2F6Ea/Hl
61 35 79 4D 7A 34 57 41  6D 73 37 79 71 6C 79 4F  a5yMz4WA ms7yqlyO
4D 44 46 37 2F 42 72 32  68 38 62 62 6D 38 6C 6A  MDF7/Br2 h8bbm8lj
71 38 2F 32 70 6D 68 34  77 73 4A 2F 61 4F 4C 5F  q8/2pmh4 wsJ/aOL_
32 42 41 6F 62 54 71 65  72 46 64 32 34 6E 6D 33  2BAobTqe rFd24nm3
77 51 4F 2F 74 6A 72 5F  32 42 6C 70 47 53 2F 53  wQO/tjr_ 2BlpGS/S
57 70 7A 43 49 4A 58 41  69 61 68 70 79 68 32 63  WpzCIJXA iahpyh2c
2F 49 56 46 34 4A 74 74  2E 62 6D 70              /IVF4Jtt .bmp

http_inspect.http_header[244]:
43 6F 6E 74 65 6E 74 2D  54 79 70 65 3A 20 6D 75  Content- Type: mu
6C 74 69 70 61 72 74 2F  66 6F 72 6D 2D 64 61 74  ltipart/ form-dat
61 3B 20 62 6F 75 6E 64  61 72 79 3D 2D 2D 2D 2D  a; bound ary=----
2D 2D 2D 2D 2D 2D 34 65  62 62 35 34 65 62 62 35  ------4e bb54ebb5
34 65 62 62 35 0D 0A 55  73 65 72 2D 41 67 65 6E  4ebb5..U ser-Agen
74 3A 20 4D 6F 7A 69 6C  6C 61 2F 34 2E 30 20 28  t: Mozil la/4.0 (
63 6F 6D 70 61 74 69 62  6C 65 3B 20 4D 53 49 45  compatib le; MSIE
20 38 2E 30 3B 20 57 69  6E 64 6F 77 73 20 4E 54   8.0; Wi ndows NT
20 36 2E 31 29 0D 0A 48  6F 73 74 3A 20 62 6C 75   6.1)..H ost: blu
65 77 61 74 65 72 73 74  6F 6E 65 2E 72 75 0D 0A  ewaterst one.ru..
43 6F 6E 74 65 6E 74 2D  4C 65 6E 67 74 68 3A 20  Content- Length:
35 31 33 0D 0A 43 6F 6E  6E 65 63 74 69 6F 6E 3A  513..Con nection:
20 4B 65 65 70 2D 41 6C  69 76 65 0D 0A 43 61 63   Keep-Al ive..Cac
68 65 2D 43 6F 6E 74 72  6F 6C 3A 20 6E 6F 2D 63  he-Contr ol: no-c
61 63 68 65                                       ache
The visual tell is right there: the original prints one flat snort.raw dump, the optimized prints separate labelled http_method, http_uri, and http_header buffers. That is how you see sticky buffers are in play. IOC is Host: bluewaterstone.ru, and the POST direction (multipart/form-data, Content-Length: 513) is the exfil.
Cerber
Cerber is the opposite lesson: a rule that is correct and still misses most of the activity. The check-in rule is UDP:
alert udp $HOME_NET any -> $EXTERNAL_NET any (msg:"Possible Cerber Check-in";
  dsize:9;
  content:"hi", depth 2, fast_pattern;
  pcre:"/^[af0-9]{7}$/R";
  detection_filter:track by_src, count 1, seconds 60;
  sid:2816763; rev:4;)
dsize:9 does the heavy lifting (payload exactly 9 bytes), content:"hi", depth 2 matches the first two bytes (safe with depth 2 here because UDP payload has no protocol preamble), fast_pattern marks hi as the prefilter, and pcre:"/^[af0-9]{7}$/R" matches seven characters after hi where /R moves the ^ anchor to where the previous content ended. One subtlety: [af0-9] is not hex, inside a character class af is two literals a and f, real hex needs [a-f0-9], harmless here only because the seven characters are all digits. detection_filter swallows the first packet per source per 60 seconds.
htb-student@ubuntu:~$ sudo snort -c /root/snorty/etc/snort/snort.lua --daq-dir /usr/local/lib/daq \
>   -r /home/htb-student/pcaps/cerber.pcap -A fast -q 2>/dev/null | grep -c '1:2816763:'
511
512 matching packets, 511 alerts, the missing one being the filter. The payload:
htb-student@ubuntu:~$ sudo tcpdump -nn -X -r /home/htb-student/pcaps/cerber.pcap 'udp[4:2] = 17' -c 1
02:17:56.486506 IP 10.0.2.15.1046 > 31.184.234.0.6892: UDP, length 9
        0x0010:  1fb8 ea00 0416 1aec 0011 8dfd 6869 3030  ............hi00
        0x0020:  3732 3839 358a 00b8 0000 2046 4545       72895......FEE
The payload is hi0072895, constant across all destinations, swept across a range on port 6892 from one source. But Snort’s codec block reported 1026 UDP packets and the rule only fired 511 times, so half the UDP is something else. Count the 9-byte payloads, then look at the rest:
htb-student@ubuntu:~$ sudo tcpdump -nn -r /home/htb-student/pcaps/cerber.pcap 'udp[4:2] = 17' | wc -l
512
htb-student@ubuntu:~$ sudo tcpdump -nn -r /home/htb-student/pcaps/cerber.pcap 'udp and not udp[4:2] = 17' | head -5
02:17:56 IP 10.0.2.15.1025 > 8.8.8.8.53: A? ipinfo.io. (27)
02:17:56 IP 8.8.8.8.53 > 10.0.2.15.1025: A 52.58.152.182, A 52.59.56.117 (59)
02:18:28 IP 10.0.2.15.1047 > 31.184.234.0.6892: UDP, length 24
02:18:28 IP 10.0.2.15.1047 > 31.184.234.1.6892: UDP, length 24
02:18:28 IP 10.0.2.15.1047 > 31.184.234.2.6892: UDP, length 24
Two things fall out. First, the malware resolved ipinfo.io before any beaconing, so it is finding its own public IP first. Second, there is a second wave 32 seconds later on the same port and range but 24 bytes each:
htb-student@ubuntu:~$ sudo tcpdump -nn -X -r /home/htb-student/pcaps/cerber.pcap 'udp[4:2] = 32' -c 1
0x0010:  1fb8 ea00 0417 1aec 0020 bf8b 3462 6439  ............4bd9
0x0020:  6265 3837 6661 3662 3030 3732 3835 3031  be87fa6b00728501
0x0030:  3430 3763                                407c
That payload is 4bd9be87fa6b00728501407c, and it carries the same 0072895 bot ID wrapped inside a longer string. So 512 + 512 + 2 DNS = 1026 accounts for everything. A stage-2 rule catches all 512 of the second wave:
alert udp $HOME_NET any -> $EXTERNAL_NET 6892 (msg:"Cerber Stage 2 - generic";
  dsize:24;
  pcre:"/^[a-f0-9]{24}$/";
  classtype:trojan-activity;
  sid:1000007; rev:1;)
And a single rule anchored on the shared bot ID catches all 1024 across both waves, but it is overfit to this one infection:
alert udp $HOME_NET any -> $EXTERNAL_NET 6892 (msg:"Cerber Check-in - either stage";
  content:"0072895"; classtype:trojan-activity; sid:1000008; rev:1;)
The lesson, versus Ursnif. Ursnif’s constraint silently broke the rule. Cerber’s rule is correct and still misses most of the activity, because it was written against one packet from one sample. Neither failure shows up as an error, and both only surface when you look at the actual traffic instead of trusting that the rule fired.
Patchwork
Patchwork is the first example written with sticky buffers from the start (the msg says AutoIt FileStealer, the course is naming the campaign):
alert http $HOME_NET any -> $EXTERNAL_NET any (msg:"OISF TROJAN Targeted AutoIt FileStealer/Downloader CnC Beacon";
  flow:established,to_server;
  http_method; content:"POST";
  http_uri; content:".php?profile=";
  http_client_body; content:"ddager=", depth 7;
  http_client_body; content:"&r1=", distance 0;
  http_header; content:!"Accept";
  http_header; content:!"Referer|3a|";
  sid:10000006; rev:1;)
http_client_body is the POST body after the headers, depth 7 on ddager= sits it at byte 1 of the body, and distance 0 on &r1= starts searching where the last match ended.
htb-student@ubuntu:~$ sudo snort -c /root/snorty/etc/snort/snort.lua --daq-dir /usr/local/lib/daq \
>   -r /home/htb-student/pcaps/patchwork.pcap -A fast -q 2>/dev/null | grep -c '1:10000006:'
257
257 beacons, all from 192.168.1.37:49250 to 212.129.13.110:80. The body is base64 host recon:
&r1=V0lOXzc=   WIN_7
&r2=WDY0       X64
&r3=MS4x       1.1
&r6=VHJ1ZQ==   True
The URI parameter cmVkc0BCUEFJTg== decodes to reds@BPAIN, and User-Agent: Mozilla/5.0 Firefox (Like Safari/Webkit) is not a real browser string, a decent hunting signal on its own. IOC: 212.129.13.110 and /dropper.php?profile=.
Patchwork SSL cert
This is the first rule going the other direction, from_server, catching what the C2 sends back:
alert tcp $EXTERNAL_NET any -> $HOME_NET any (msg:"Patchwork SSL Cert Detected";
  flow:established,from_server;
  content:"|55 04 03|";
  content:"|08|toigetgf", distance 1, within 9;
  classtype:trojan-activity;
  sid:10000008; rev:1;)
It is alert tcp, not alert http, because TLS is not HTTP and the certificate is exchanged in cleartext during the handshake before encryption starts, so there are no HTTP sticky buffers. |55 04 03| is the ASN.1 OID for commonName, distance 1 skips one byte (the 0C UTF8String tag), and |08|toigetgf matches the ASN.1 encoding of a CN that is exactly toigetgf (08 is the length prefix, toigetgf is 8 characters), with within 9 allowing exactly the length byte plus 8 characters.
htb-student@ubuntu:~$ sudo snort -c /root/snorty/etc/snort/snort.lua --daq-dir /usr/local/lib/daq \
>   -r /home/htb-student/pcaps/patchwork.pcap -A fast -q 2>/dev/null | grep -c '1:10000008:'
2
[1:10000008:1] "Patchwork SSL Cert Detected" {TCP} 45.43.192.172:8443 -> 192.168.1.37:49211
ssl.stream_tcp[807]:
0F 06 03 55 04 03 0C 08  74 6F 69 67 65 74 67 66  ...U.... toigetgf
30 1E 17 0D 31 34 31 31  31 38 30 36 30 38 33 38  0...1411 18060838
5A 17 0D 32 34 31 31 31  35 30 36 30 38 33 38 5A  Z..24111 5060838Z
30 13 31 11 30 0F 06 03  55 04 03 0C 08 74 6F 69  0.1.0... U....toi
67 65 74 67 66 30 82 01  22 30 0D 06 09 2A 86 48  getgf0.. "0...*.H
The buffer is labelled ssl.stream_tcp, so the ssl inspector reassembled the TLS handshake and matched the reassembled stream. The cert is a ten-year self-signed one (141118060838Z to 241115060838Z, Nov 2014 to Nov 2024, subject equals issuer). Server is 45.43.192.172:8443, different from the HTTP beacon at 212.129.13.110:80, so there are two separate C2 channels in the same PCAP. IOC: CN toigetgf and 45.43.192.172:8443. One correction to the course: it says within counts from the start of the payload, but relative keywords measure from where the previous match ended.
Assessment: log4shell
For the Snort rule-dev assessment, the log4shell.pcap rule (sid 10000098) has the payload in the user agent, and the task is the keyword to put right before its content. Snort 3 has http_header but no http_user_agent (confirmed with snort --list-plugins 2>&1 | grep -i http), so:
htb-student@ubuntu:~$ sudo sed -i 's/content:"|24 7b|jndi/http_header; content:"|24 7b|jndi/' /home/htb-student/local.rules
htb-student@ubuntu:~$ sudo snort -c /root/snorty/etc/snort/snort.lua --daq-dir /usr/local/lib/daq \
>   -r /home/htb-student/pcaps/log4shell.pcap -A fast -q 2>/dev/null | grep -c '1:10000098:'
15
Adding http_header; before the |24 7b|jndi content gives 15 alerts. The answer is http_header;.
Zeek
Zeek is an open-source network traffic analyzer, and rather than a signature-based IDS it is a customizable platform for behavioral analysis. It splits into two parts: the Event Engine passively captures packets via libpcap and turns them into policy-neutral events (it registers an http_request event with all its details but does not judge whether it is malicious), and the Script Interpreter runs event handlers written in Zeek’s scripting language that express the site’s security policy.
What makes Zeek useful for hunting is the logs. By default it writes structured ASCII logs like conn.log (every IP, TCP, UDP, and ICMP connection), dns.log, and http.log. It inspects application protocols regardless of port, can analyse file content, and interfaces with backends like Elasticsearch. You query the logs with zeek-cut, which pulls named columns out of the tab-separated files. It is not on PATH by default:
htb-student@ubuntu:~$ export PATH=$PATH:/usr/local/zeek/bin
Beaconing malware
Generate logs from a PCAP, then read the key connection fields (-d converts the epoch timestamp to readable time):
htb-student@ubuntu:~$ /usr/local/zeek/bin/zeek -C -r /home/htb-student/pcaps/psempire.pcap
htb-student@ubuntu:~$ cat conn.log | zeek-cut -d ts id.resp_h id.resp_p service duration
2017-11-21T13:03:59+0000   51.15.197.127   80   http   2.186789
2017-11-21T13:03:56+0000   ff02::1:3       5355 dns    0.094916
2017-11-21T13:03:56+0000   224.0.0.252     5355 dns    0.094893
2017-11-21T13:04:05+0000   51.15.197.127   80   http   0.214611
... (continues every ~5s to 51.15.197.127:80)
A connection every roughly 5 seconds to 51.15.197.127:80, all HTTP, all short duration. That regular spacing is a beacon. The two dns lines at 13:03:56 (ff02::1:3 and 224.0.0.252 on 5355) are LLMNR, unrelated. Count the destinations:
htb-student@ubuntu:~$ cat conn.log | /usr/local/zeek/bin/zeek-cut id.resp_h | sort | uniq -c | sort -rn
     45 51.15.197.127
      1 ff02::1:3
      1 224.0.0.252
45 connections to one external host. Then read what the beacon requested:
htb-student@ubuntu:~$ cat http.log | /usr/local/zeek/bin/zeek-cut ts method host uri status_code request_body_len response_body_len user_agent
Three URIs rotate (/admin/get.php, /news.php, /login/process.php), the same IE11 user agent is on every request, most lines are GET check-ins with 0 bytes up and 173 down, the first GET at 13:03:59 pulled 5330 bytes (staging), and a POST to /login/process.php at 13:04:06 pulled 39274 bytes. Those three .php URIs and the IE11 user agent are PowerShell Empire’s default profile.
DNS exfil
After generating logs from dnsexfil.pcapng, strip each query to its last two labels and count:
htb-student@ubuntu:~$ /usr/local/zeek/bin/zeek -C -r /home/htb-student/pcaps/dnsexfil.pcapng
htb-student@ubuntu:~$ cat dns.log | /usr/local/zeek/bin/zeek-cut query | rev | cut -d. -f1,2 | rev | sort | uniq -c | sort -rn | head
  17738 letsgohunt.online
    216 windomain.local
     51 in-addr.arpa
17,738 queries to letsgohunt.online against a next-highest of 216. Check the query type:
htb-student@ubuntu:~$ cat dns.log | /usr/local/zeek/bin/zeek-cut qtype_name | sort | uniq -c | sort -rn
  17960 A
     64 SOA
     46 SRV
All A records, not TXT or NULL. That matters: people expect exfil over TXT, so filtering only on TXT would miss this entirely. Look at the queries:
htb-student@ubuntu:~$ cat dns.log | /usr/local/zeek/bin/zeek-cut query | grep letsgohunt.online | head
456c54f2.blue.letsgohunt.online
www.180.0c9a5671.456c54f2.blue.letsgohunt.online
www.1204192da26d109d4.1c9a5671.456c54f2.blue.letsgohunt.online
Each query breaks down as the attacker domain, a channel label (blue), a constant session ID (456c54f2), an incrementing counter (so the receiver can reorder chunks), and a long hex label that is the smuggled data, with www. as cosmetic filler. Each lookup carries one chunk out, and the query itself is the channel so no response is needed. The signal is huge query volume to one second-level domain, long high-entropy leftmost labels, and a constant session label plus incrementing counter, all over A records.
TLS exfil
With encrypted traffic you cannot read what left, so you look at the shape: byte direction in conn.log, handshake in ssl.log. Generate the logs, then sort conn.log by bytes sent out:
htb-student@ubuntu:~$ /usr/local/zeek/bin/zeek -C -r /home/htb-student/pcaps/<file>.pcap
htb-student@ubuntu:~$ cat conn.log | /usr/local/zeek/bin/zeek-cut id.orig_h id.resp_h id.resp_p service orig_bytes resp_bytes | sort -t$'\t' -k5 -rn | head
10.0.10.100   192.168.151.181   443   ssl   525983   301
10.0.10.100   192.168.151.181   443   ssl   525919   301
10.0.10.100   192.168.151.181   443   ssl   525903   301
SSL traffic sending roughly 526KB up against only 301 bytes back, a ratio that is backwards for normal TLS. Total the volume, grouped by source and destination:
htb-student@ubuntu:~$ cat conn.log | /usr/local/zeek/bin/zeek-cut id.orig_h id.resp_h orig_bytes | sort | grep -v -e '^$' | grep -v '-' | datamash -g 1,2 sum 3 | sort -k 3 -rn | head
10.0.10.100   192.168.151.181   270775912
10.0.10.100   10.0.10.1         0
datamash -g 1,2 sum 3 groups by source and destination and sums the bytes: 270,775,912 (about 270MB) over 2,929 connections from 10.0.10.100 to 192.168.151.181. Check the handshake:
htb-student@ubuntu:~$ cat ssl.log | /usr/local/zeek/bin/zeek-cut id.resp_h server_name version cipher validation_status | sort | uniq -c | sort -rn | head
   2928 192.168.151.181 -   TLSv12   TLS_ECDHE_RSA_WITH_AES_256_GCM_SHA384
server_name is blank (-) on all 2,928 connections, but real clients send SNI, so thousands of connections with no SNI is not normal software. The signal is one client pushing ~526KB up and 301 down per connection, repeated ~2,929 times to one host, no SNI, uniform TLSv1.2 cipher, and both IPs internal so the collection point is inside the network.
PsExec
Generating logs from psexec_add_user.pcap, the footprint is spread across smb_mapping, smb_files, and dce_rpc:
htb-student@ubuntu:~$ /usr/local/zeek/bin/zeek -C -r /home/htb-student/pcaps/psexec_add_user.pcap
htb-student@ubuntu:~$ cat smb_mapping.log | /usr/local/zeek/bin/zeek-cut path share_type | sort | uniq -c
      2 \\dc1\ADMIN$   DISK
      1 \\dc1\IPC$     PIPE
ADMIN$ is where the service binary is dropped, IPC$ is the control pipe, and the target is dc1, a domain controller. The service binary:
htb-student@ubuntu:~$ cat smb_files.log | /usr/local/zeek/bin/zeek-cut ts name action | grep -iE 'psexe|\.exe'
1507567479.268789   PSEXESVC.exe   SMB::FILE_OPEN
1507567500.496785   PSEXESVC.exe   SMB::FILE_OPEN
1507567500.496785   PSEXESVC.exe   SMB::FILE_DELETE
PSEXESVC.exe (the default PsExec service name) opened then deleted. The service control calls:
htb-student@ubuntu:~$ cat dce_rpc.log | /usr/local/zeek/bin/zeek-cut ts endpoint operation | sort | uniq -c | sort -rn
The svcctl sequence, in time order: ept_map to locate svcctl, OpenSCManagerW, CreateServiceWOW64W to install, OpenServiceW, StartServiceW to run (the payload executes here), QueryServiceStatus, ControlService to stop, OpenServiceW, DeleteService to clean up, all within one second. Create, Start, Control, Delete is the classic PsExec run-and-clean, and it correlates cleanly across the three logs on the same timestamps (binary dropped at 1507567479.26, CreateServiceWOW64W at 1507567500.28, StartServiceW at 1507567500.30, PSEXESVC.exe deleted at 1507567500.49). CreateServiceWOW64W rather than plain CreateServiceW means a 32-bit service was pushed to a 64-bit target. The two regexes worth keeping:
htb-student@ubuntu:~$ cat smb_files.log | zeek-cut name | grep -iE 'psexe.*\.exe'
htb-student@ubuntu:~$ cat dce_rpc.log | zeek-cut operation | grep -iE 'CreateService|StartService|DeleteService'
Assessment: PrintNightmare and REvil
For PrintNightmare (CVE-2021-34527), which abuses the print spooler RPC interface, the spooler calls are DCE/RPC so they land in dce_rpc.log under the spoolss endpoint:
htb-student@ubuntu:~$ /usr/local/zeek/bin/zeek -C -r /home/htb-student/pcaps/printnightmare.pcap
htb-student@ubuntu:~$ cat dce_rpc.log | /usr/local/zeek/bin/zeek-cut endpoint operation | sort | uniq -c | sort -rn
      3 spoolss RpcAddPrinterDriverEx
      2 spoolss RpcEnumPrinterDrivers
RpcAddPrinterDriverEx is the function PrintNightmare abuses to load a malicious driver DLL. The answer is dce_rpc.log. For REvil/Kaseya, the bytes transmitted to 178.23.155.240 means orig_bytes where that IP is the destination:
htb-student@ubuntu:~$ /usr/local/zeek/bin/zeek -C -r /home/htb-student/pcaps/revilkaseya.pcap
htb-student@ubuntu:~$ cat conn.log | /usr/local/zeek/bin/zeek-cut id.orig_h id.resp_h orig_bytes | grep 178.23.155.240 | datamash -g 1,2 sum 3
192.168.100.154 178.23.155.240  2311
Victim 192.168.100.154 sent 2311 bytes.
Skills Assessment
Three graded scenarios, one per tool.
Zeek: Gootkit SSL certificate
Gootkit beacons to its C2 over TLS with a self-signed certificate whose subject is MyCompany Ltd, a placeholder no real service uses, and that certificate is the detection point. Two logs expose it and they join on the certificate fingerprint: ssl.log links each TLS connection to the cert it used (via cert_chain_fps), and x509.log holds the certificate’s subject and issuer keyed by fingerprint. Generate logs, then find the bad cert:
htb-student@sigdev:~$ /usr/local/zeek/bin/zeek -C -r /home/htb-student/pcaps/neutrinogootkit.pcap
htb-student@sigdev:~$ cat x509.log | /usr/local/zeek/bin/zeek-cut certificate.subject certificate.issuer | grep -i "MyCompany"
CN=localhost,OU=IT,O=MyCompany Ltd.,L=York,ST=Yorks,C=GB    CN=localhost,OU=IT,O=MyCompany Ltd.,L=York,ST=Yorks,C=GB
Subject equals issuer, so it is self-signed, and CN=localhost, O=MyCompany Ltd. is placeholder filler no real service ships. Note its fingerprint, then pivot into ssl.log, whose cert_chain_fps field carries the same hash:
htb-student@sigdev:~$ fp=$(cat x509.log | /usr/local/zeek/bin/zeek-cut fingerprint certificate.subject | grep -i MyCompany | cut -f1)
htb-student@sigdev:~$ cat ssl.log | /usr/local/zeek/bin/zeek-cut id.orig_h id.resp_h id.resp_p server_name cert_chain_fps | grep "$fp"
192.168.55.142  93.115.10.203  domptorang.com  1d43976111c0431412f082a311fcc0a42127553a1d3d570a41191ad6678a0207
That gives the connection: victim 192.168.55.142 to C2 93.115.10.203, SNI domptorang.com, and the TLS is on port 80 rather than 443, another tell. The field carrying the MyCompany Ltd. trace is the answer: certificate.subject.
Snort: Overpass-the-Hash
Overpass-the-Hash forges a Kerberos AS-REQ from a stolen NTLM hash, and the tell is the encryption type on the pre-auth timestamp. A modern client uses AES256-CTS-HMAC-SHA1-96 (etype 18 = 0x12), and the attack falls back to RC4-HMAC (etype 23 = 0x17). The rule (sid 9999999) has a placeholder XX in the etype field:
htb-student@sigdev:~$ grep -n "sid" /home/htb-student/local.rules
alert tcp $HOME_NET any -> any 88 (msg: "Kerberos Ticket Encryption Downgrade to RC4 Detected"; flow: no_stream, established, to_server; content: "|A1 03 02 01 05 A2 03 02 01 0A|", offset 12, depth 10; content: "|A1 03 02 01 02|", distance 5, within 6; content: "|A0 03 02 01 XX|", distance 6, within 6; content: "krbtgt", distance 0; sid:9999999;)
|A0 03 02 01 XX| is the ASN.1-encoded etype as a one-byte hex integer. Since RC4-HMAC is 23 decimal = 0x17, XX = 17. Replace it, uncomment, run, and count:
htb-student@sigdev:~$ sudo sed -i '19s/XX/17/; 19s/^#//' /home/htb-student/local.rules
htb-student@sigdev:~$ sudo snort -c /root/snorty/etc/snort/snort.lua --daq-dir /usr/local/lib/daq \
>   -r /home/htb-student/pcaps/wannamine.pcap -A fast -q 2>/dev/null | grep -c '1:9999999:'
4
4 alerts confirm it. The answer is XX = 17.
Suricata: WMI execution (wmiexec)
wmiexec.py runs commands on a remote host over WMI carried by DCERPC over SMB (port 445), creating a Win32_Process, configuring a Win32_ProcessStartup, then calling Create to spawn cmd.exe or powershell.exe. The rule (sid 2024233) is commented with two content keywords, and the task is to add one more content right after msg:
htb-student@sigdev:~$ grep -n "2024233" /home/htb-student/local.rules
23:#alert tcp any any -> any any (msg:"WMI Execution Detected"; content:"Win32_ProcessStartup"; content:"powershell"; sid:2024233; rev:2;)
Rather than guess, check what Win32_ strings the traffic actually carries:
htb-student@sigdev:~$ strings /home/htb-student/pcaps/pipekatposhc2.pcap | grep -i "Win32_" | sort | uniq -c | sort -rn
      3 WMI|Win32_ProcessStartup
      3 object:Win32_ProcessStartup
      2 Win32_Process
Win32_Process is present separately from Win32_ProcessStartup, so add it after msg and uncomment the rule:
htb-student@sigdev:~$ sudo sed -i '23s/msg:"WMI Execution Detected"; /msg:"WMI Execution Detected"; content:"Win32_Process"; /; 23s/^#//' /home/htb-student/local.rules
alert tcp any any -> any any (msg:"WMI Execution Detected"; content:"Win32_Process"; content:"Win32_ProcessStartup"; content:"powershell"; sid:2024233; rev:2;)
Run Suricata and check the alert:
htb-student@sigdev:~$ sudo suricata -r /home/htb-student/pcaps/pipekatposhc2.pcap -k none -l .
htb-student@sigdev:~$ cat fast.log
12/26/2019-08:04:55.353819  [**] [1:2024233:2] WMI Execution Detected [**] [Classification: (null)] [Priority: 3] {TCP} 192.168.1.46:58198 -> 192.168.1.62:49154
One alert, attacker 192.168.1.46 executing WMI against target 192.168.1.62 on port 49154 (a high DCERPC port, the DCOM/WMI endpoint after the initial epmapper negotiation). The intended answer is Create, the WMI method that actually spawns the process. Both Win32_Process and Create make the rule fire, because the wmiexec flow contains all of Win32_Process, Win32_ProcessStartup, powershell, and Create, and the rule alerts once all its content strings are present. One practical note: fast.log appends, so delete it between runs or old alerts pile up and the counts mislead.
Key Takeaway
- This module was three tools doing the same job three ways. Suricata and Snort match rules against traffic and alert or block, Zeek turns traffic into structured logs you hunt through. Knowing which one to reach for is half the skill.
- The recurring Suricata and Snort lesson is that the rule firing is not proof the rule is right. Ursnif’s
depth 12silently missed the POST, and Cerber’s correct rule still missed half the traffic (the second 24-byte wave) because it was written against one packet. Both only showed up by looking at the actual traffic with tcpdump. - Sticky buffers (
http_uri,http_header,http_client_body) are what make HTTP rules both accurate and readable, and their labelled output is the visual tell that they are working versus a flat raw dump. - Encrypted traffic is still detectable. TLS certificate byte patterns caught Dridex and Patchwork, JA3 fingerprints caught Sliver and Trickbot, and a self-signed cert subject caught Gootkit. You read the handshake, not the payload.
- Zeek’s strength is the pivot. Fingerprint joins
x509.logtossl.log,flow_idties events together, and byte-direction plus missing SNI inconn.logandssl.logexposed a 270MB TLS exfil that no signature would have flagged. - For the assessments, the answers came from reading the protocol, not guessing: a Kerberos etype downgrade to
0x17, the WMICreatemethod on the wire, and thecertificate.subjectfield carrying the placeholder cert.
References
- HTB Academy - Intrusion Detection & Prevention Systems
- Suricata documentation
- Snort 3 documentation
- Zeek documentation
- Emerging Threats - Open Ruleset