Module 8: Intro to Network Traffic Analysis
These are my notes for Module 8. It is a single chapter that runs from network traffic analysis fundamentals and the core protocols, through the analysis process and tcpdump on the command line, and finishes with a set of Wireshark labs - carving files out of HTTP and FTP, working a guided intrusion case around port 4444, and decrypting an RDP session with the server’s RSA key.
Back to Module 7: Module 7: Introduction to Threat Hunting & Hunting With Elastic
Module 8 Navigation
On this page
Introduction: Network Traffic Analysis Fundamentals
Network Traffic Analysis is the process of examining network data to characterize common ports and protocols, establish environmental baselines, and monitor for threats. By understanding typical traffic patterns, security specialists can quickly identify anomalies, such as port scans or unauthorized communications, and disrupt adversarial tactics.
Core Knowledge and Skills
Effective analysis requires a strong foundation in:
- TCP/IP and OSI Models: Understanding how traffic interacts with applications and moves through network layers.
- Protocol Encapsulation: Recognizing how headers change as data moves through the stack to move through data more efficiently.
- TCP vs. UDP: Differentiating between stream-oriented TCP and the less complete, connectionless UDP.
The Analyst’s Toolkit
Analysts use various tools to capture and dissect traffic:
- Command-Line Utilities: tcpdump for packet capture, TShark for decoding, and NGrep for regex-based pattern matching.
- Graphical Analysis: Wireshark provides an in-depth, visual look into frames and protocols.
- Filtering (BPF): Most tools utilize Berkeley Packet Filter (BPF) syntax, a standard method for filtering and decoding data at the Data-Link layer.
- Hardware: Network Taps and SPAN ports are used to copy traffic from network segments for analysis.
The NTA Workflow
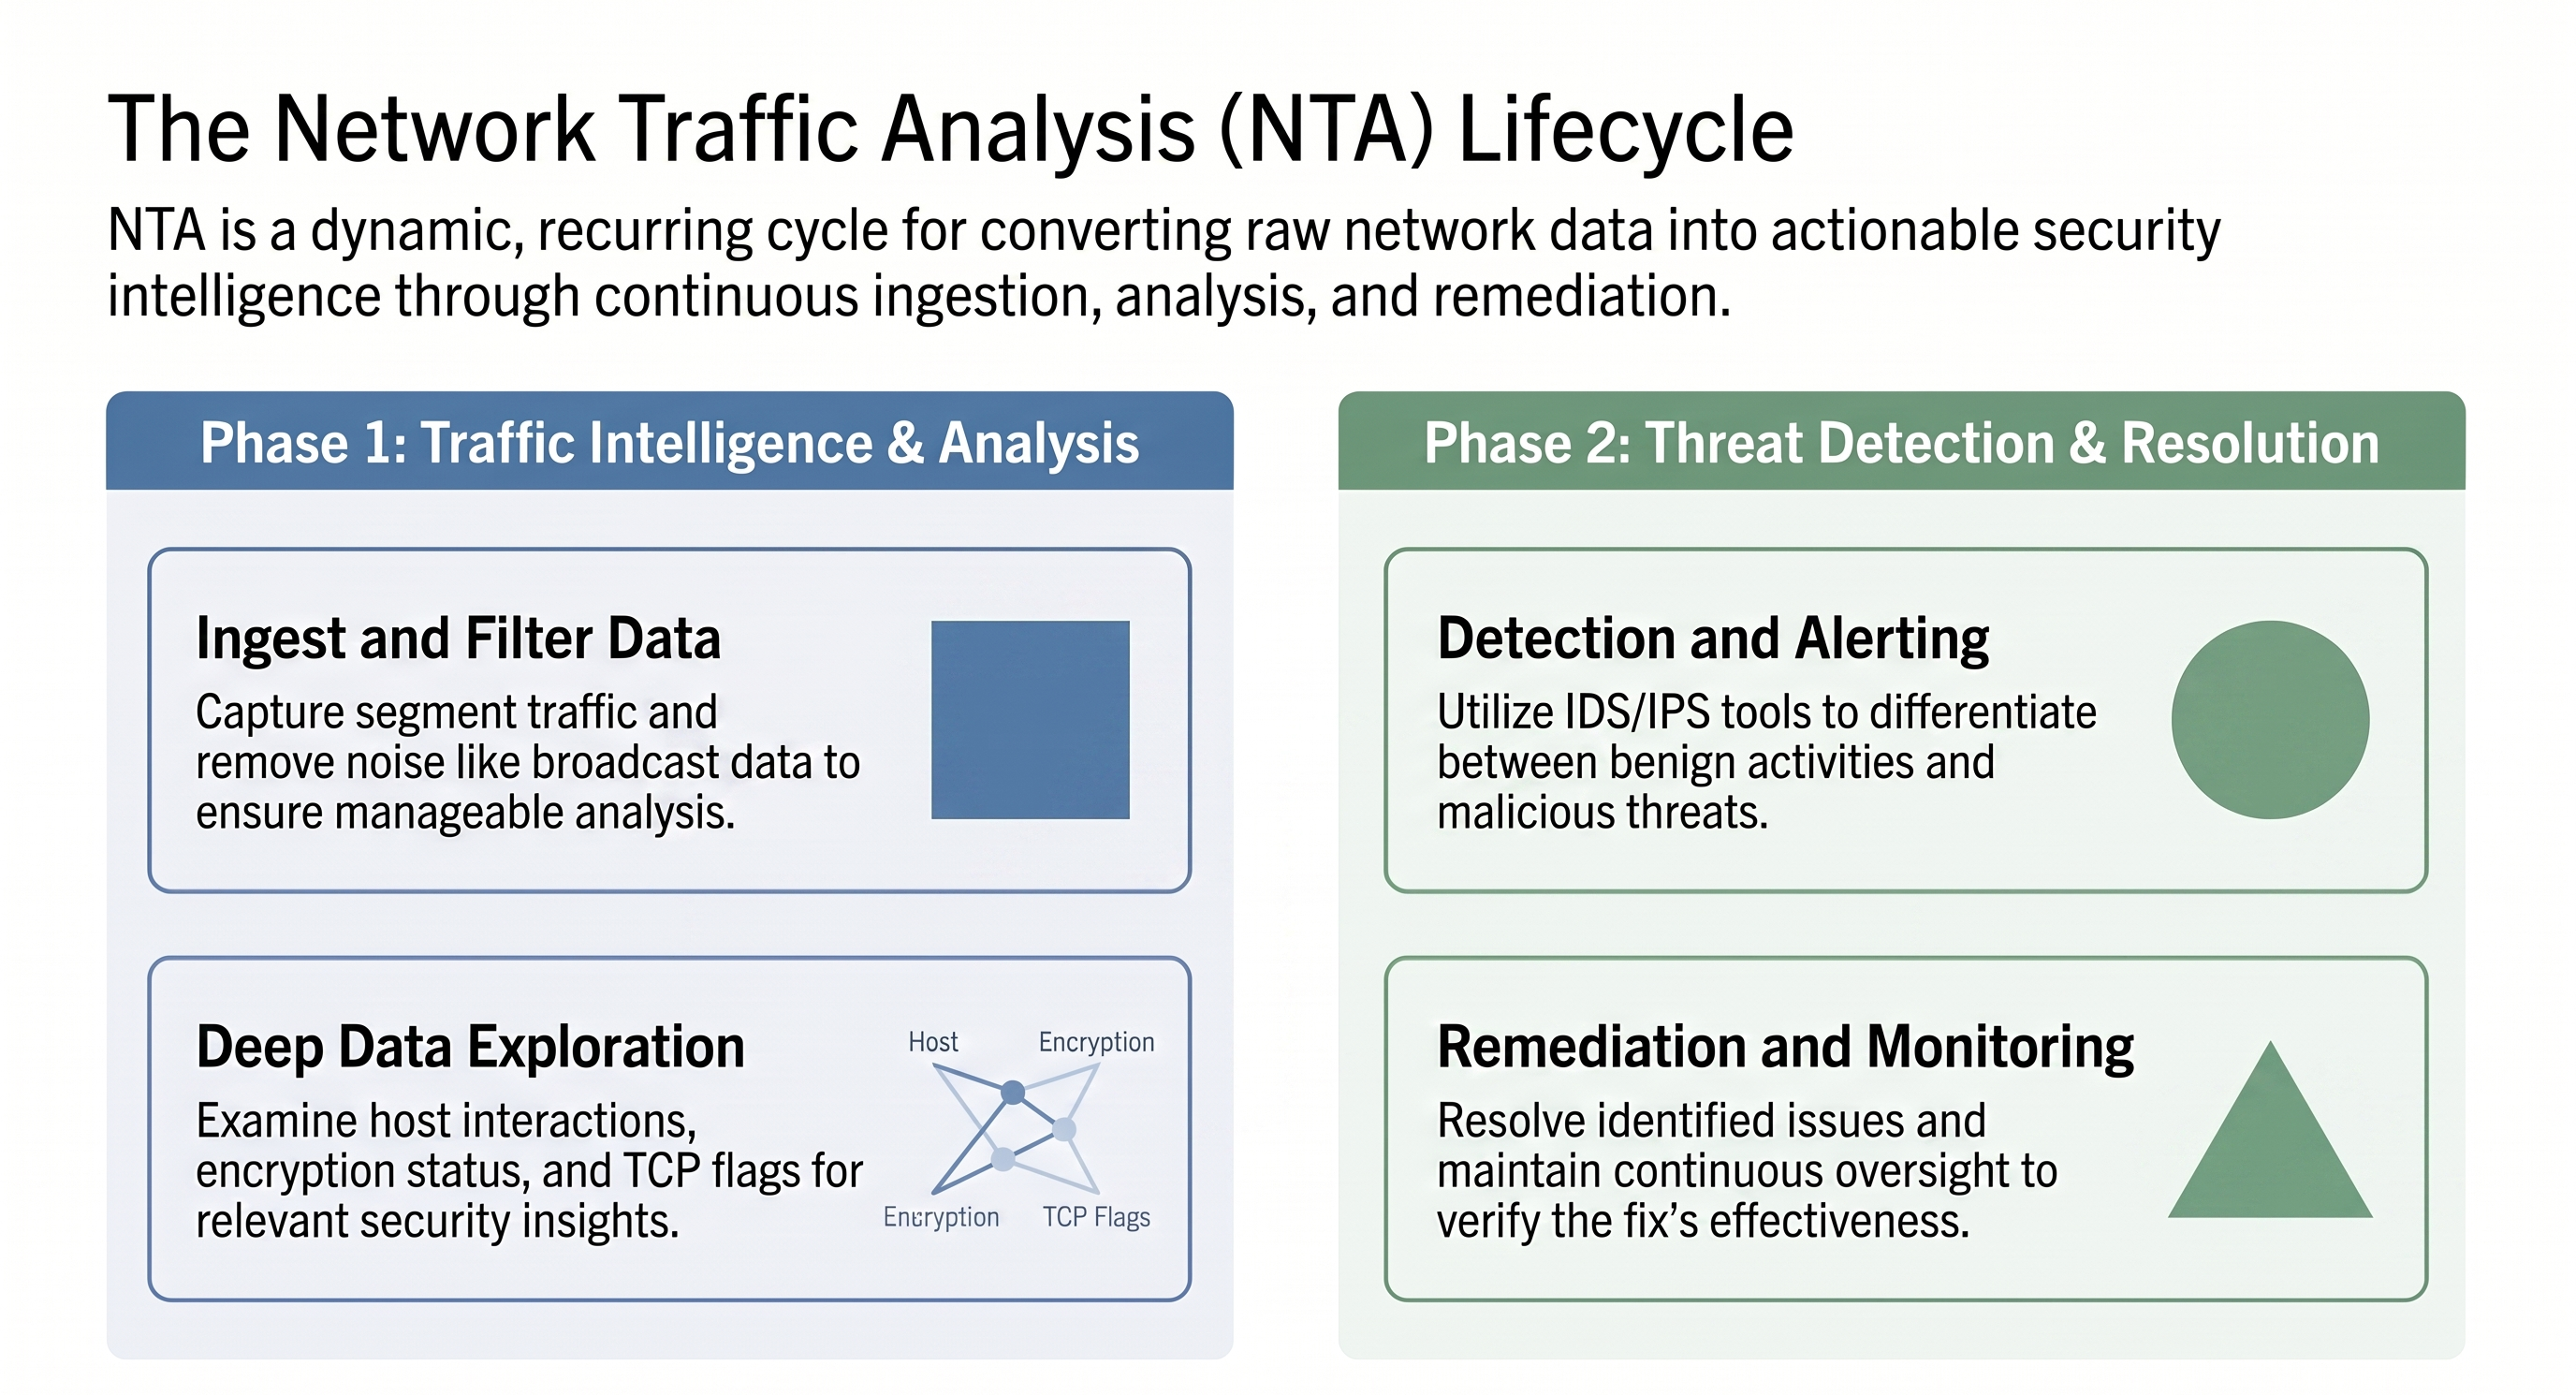
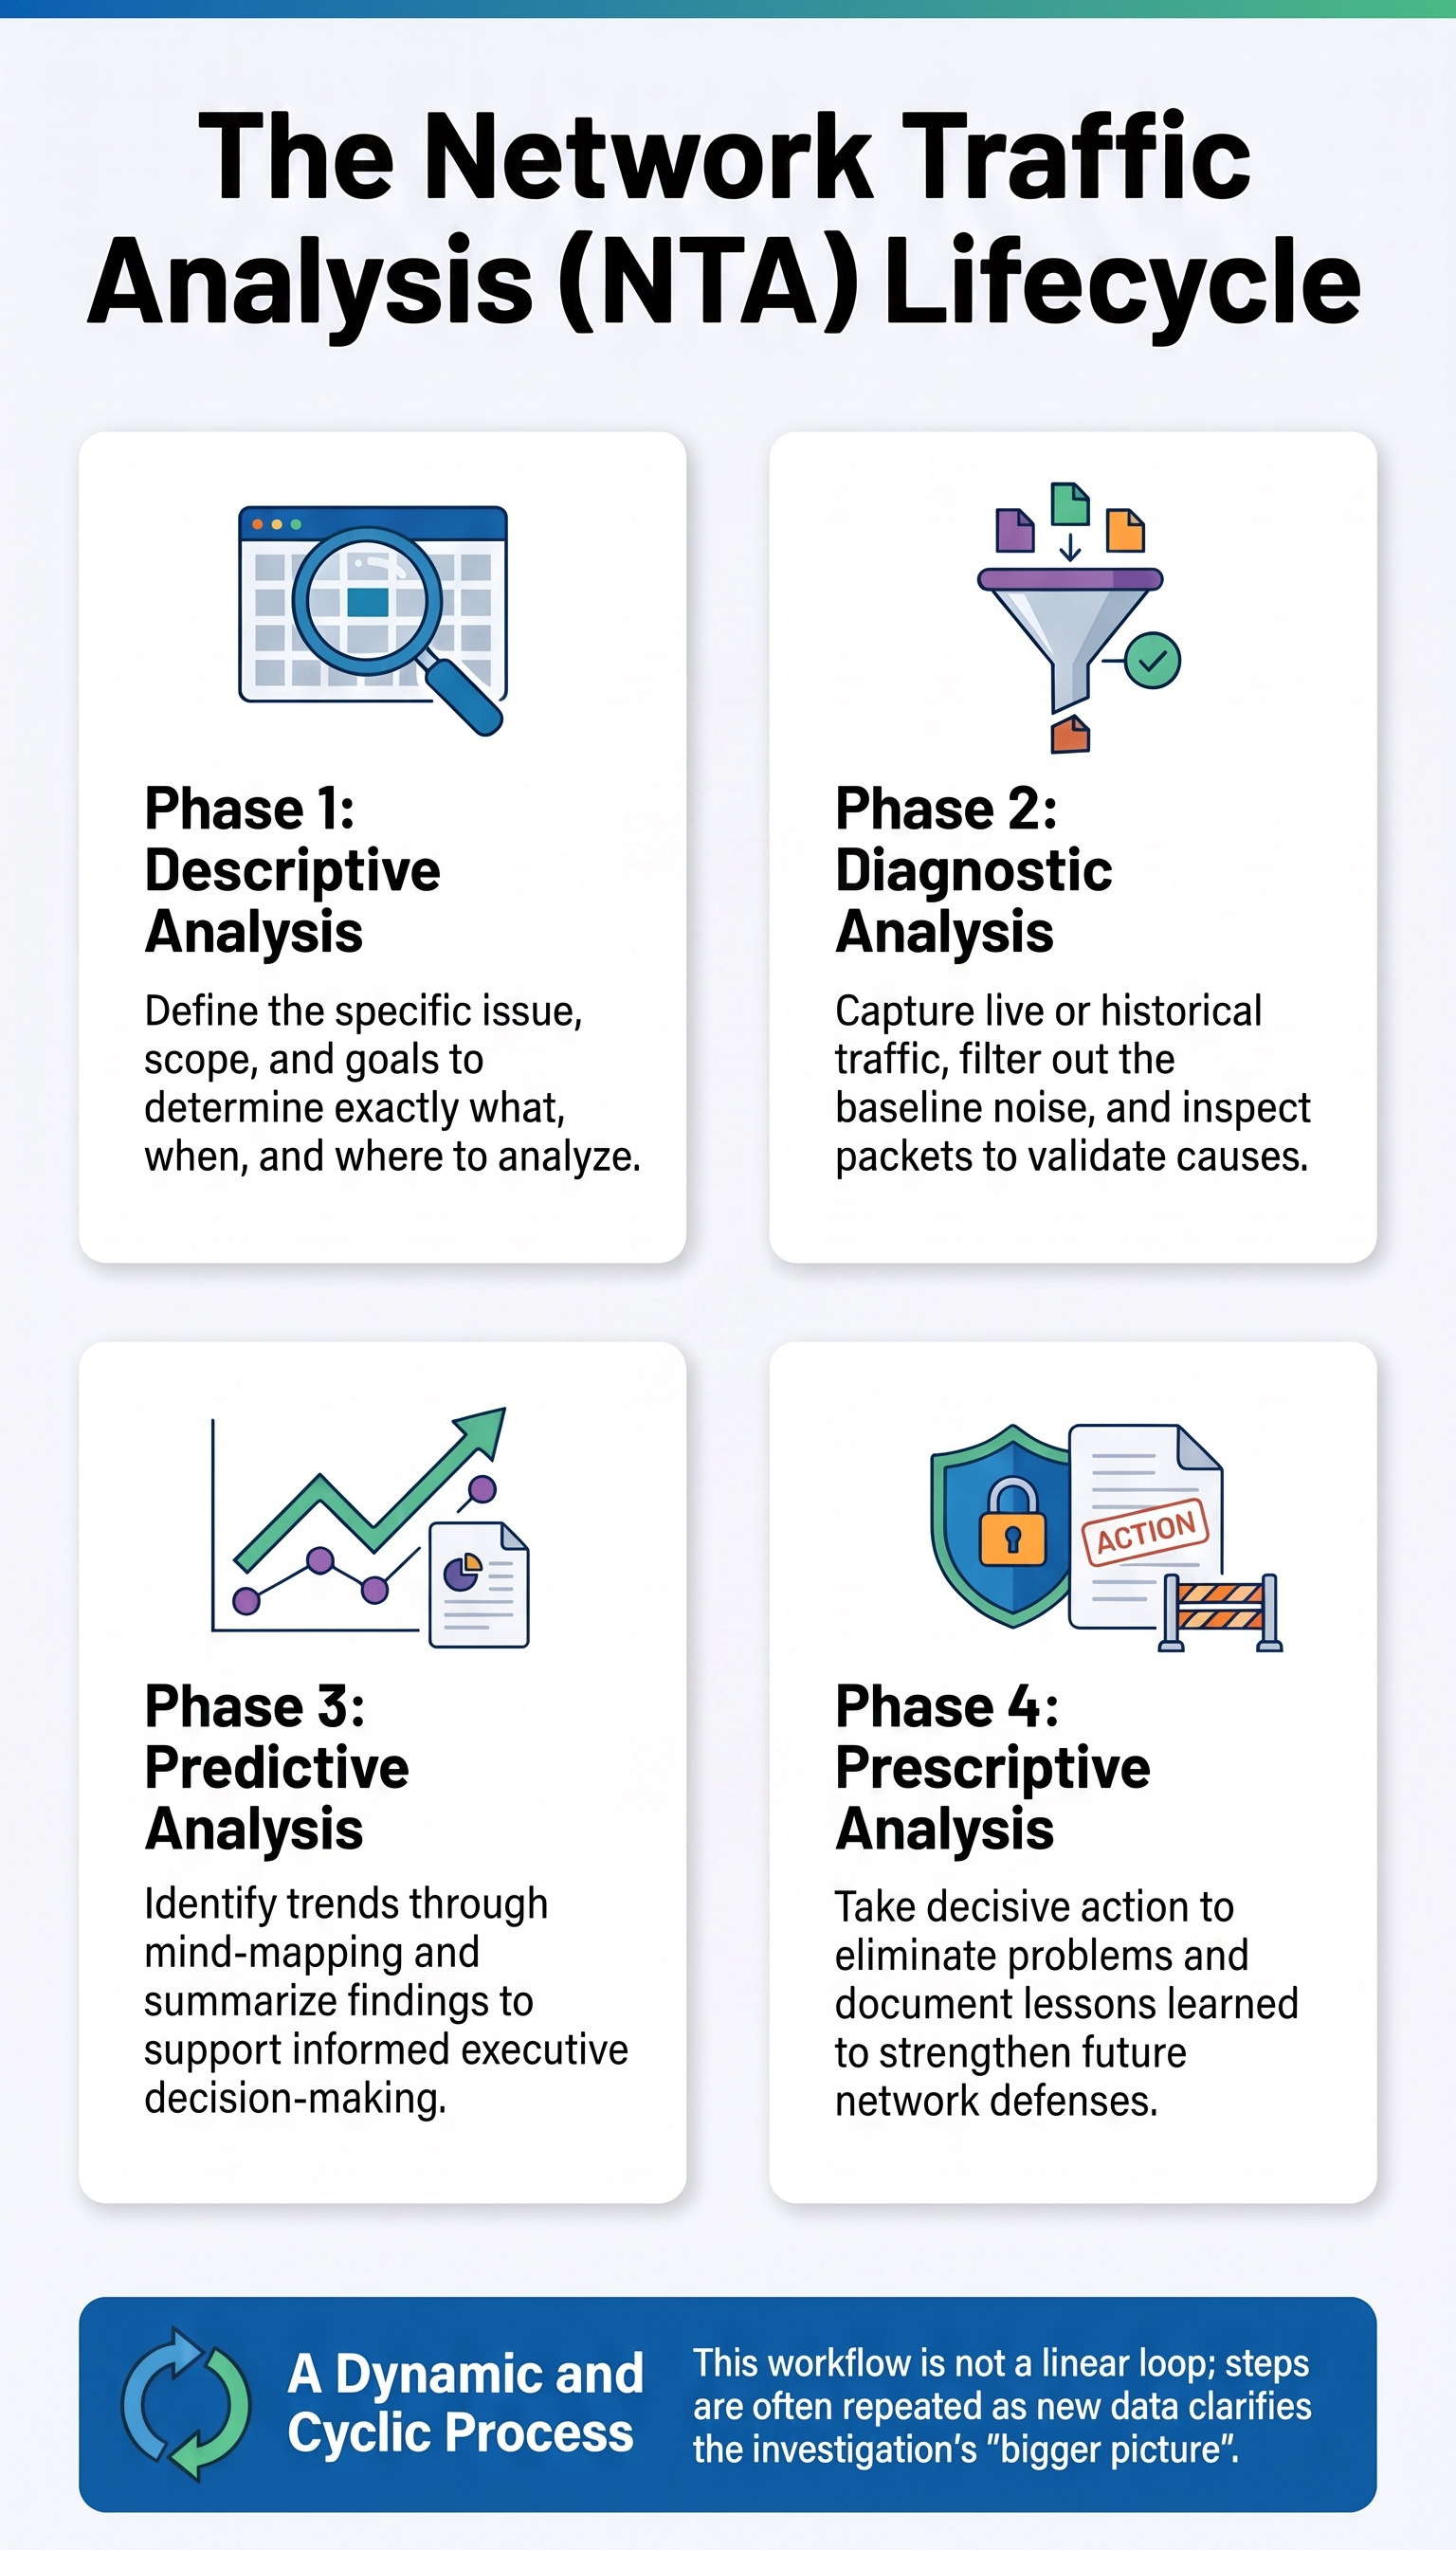
NTA is a dynamic cycle rather than a linear process, shown in the image below.
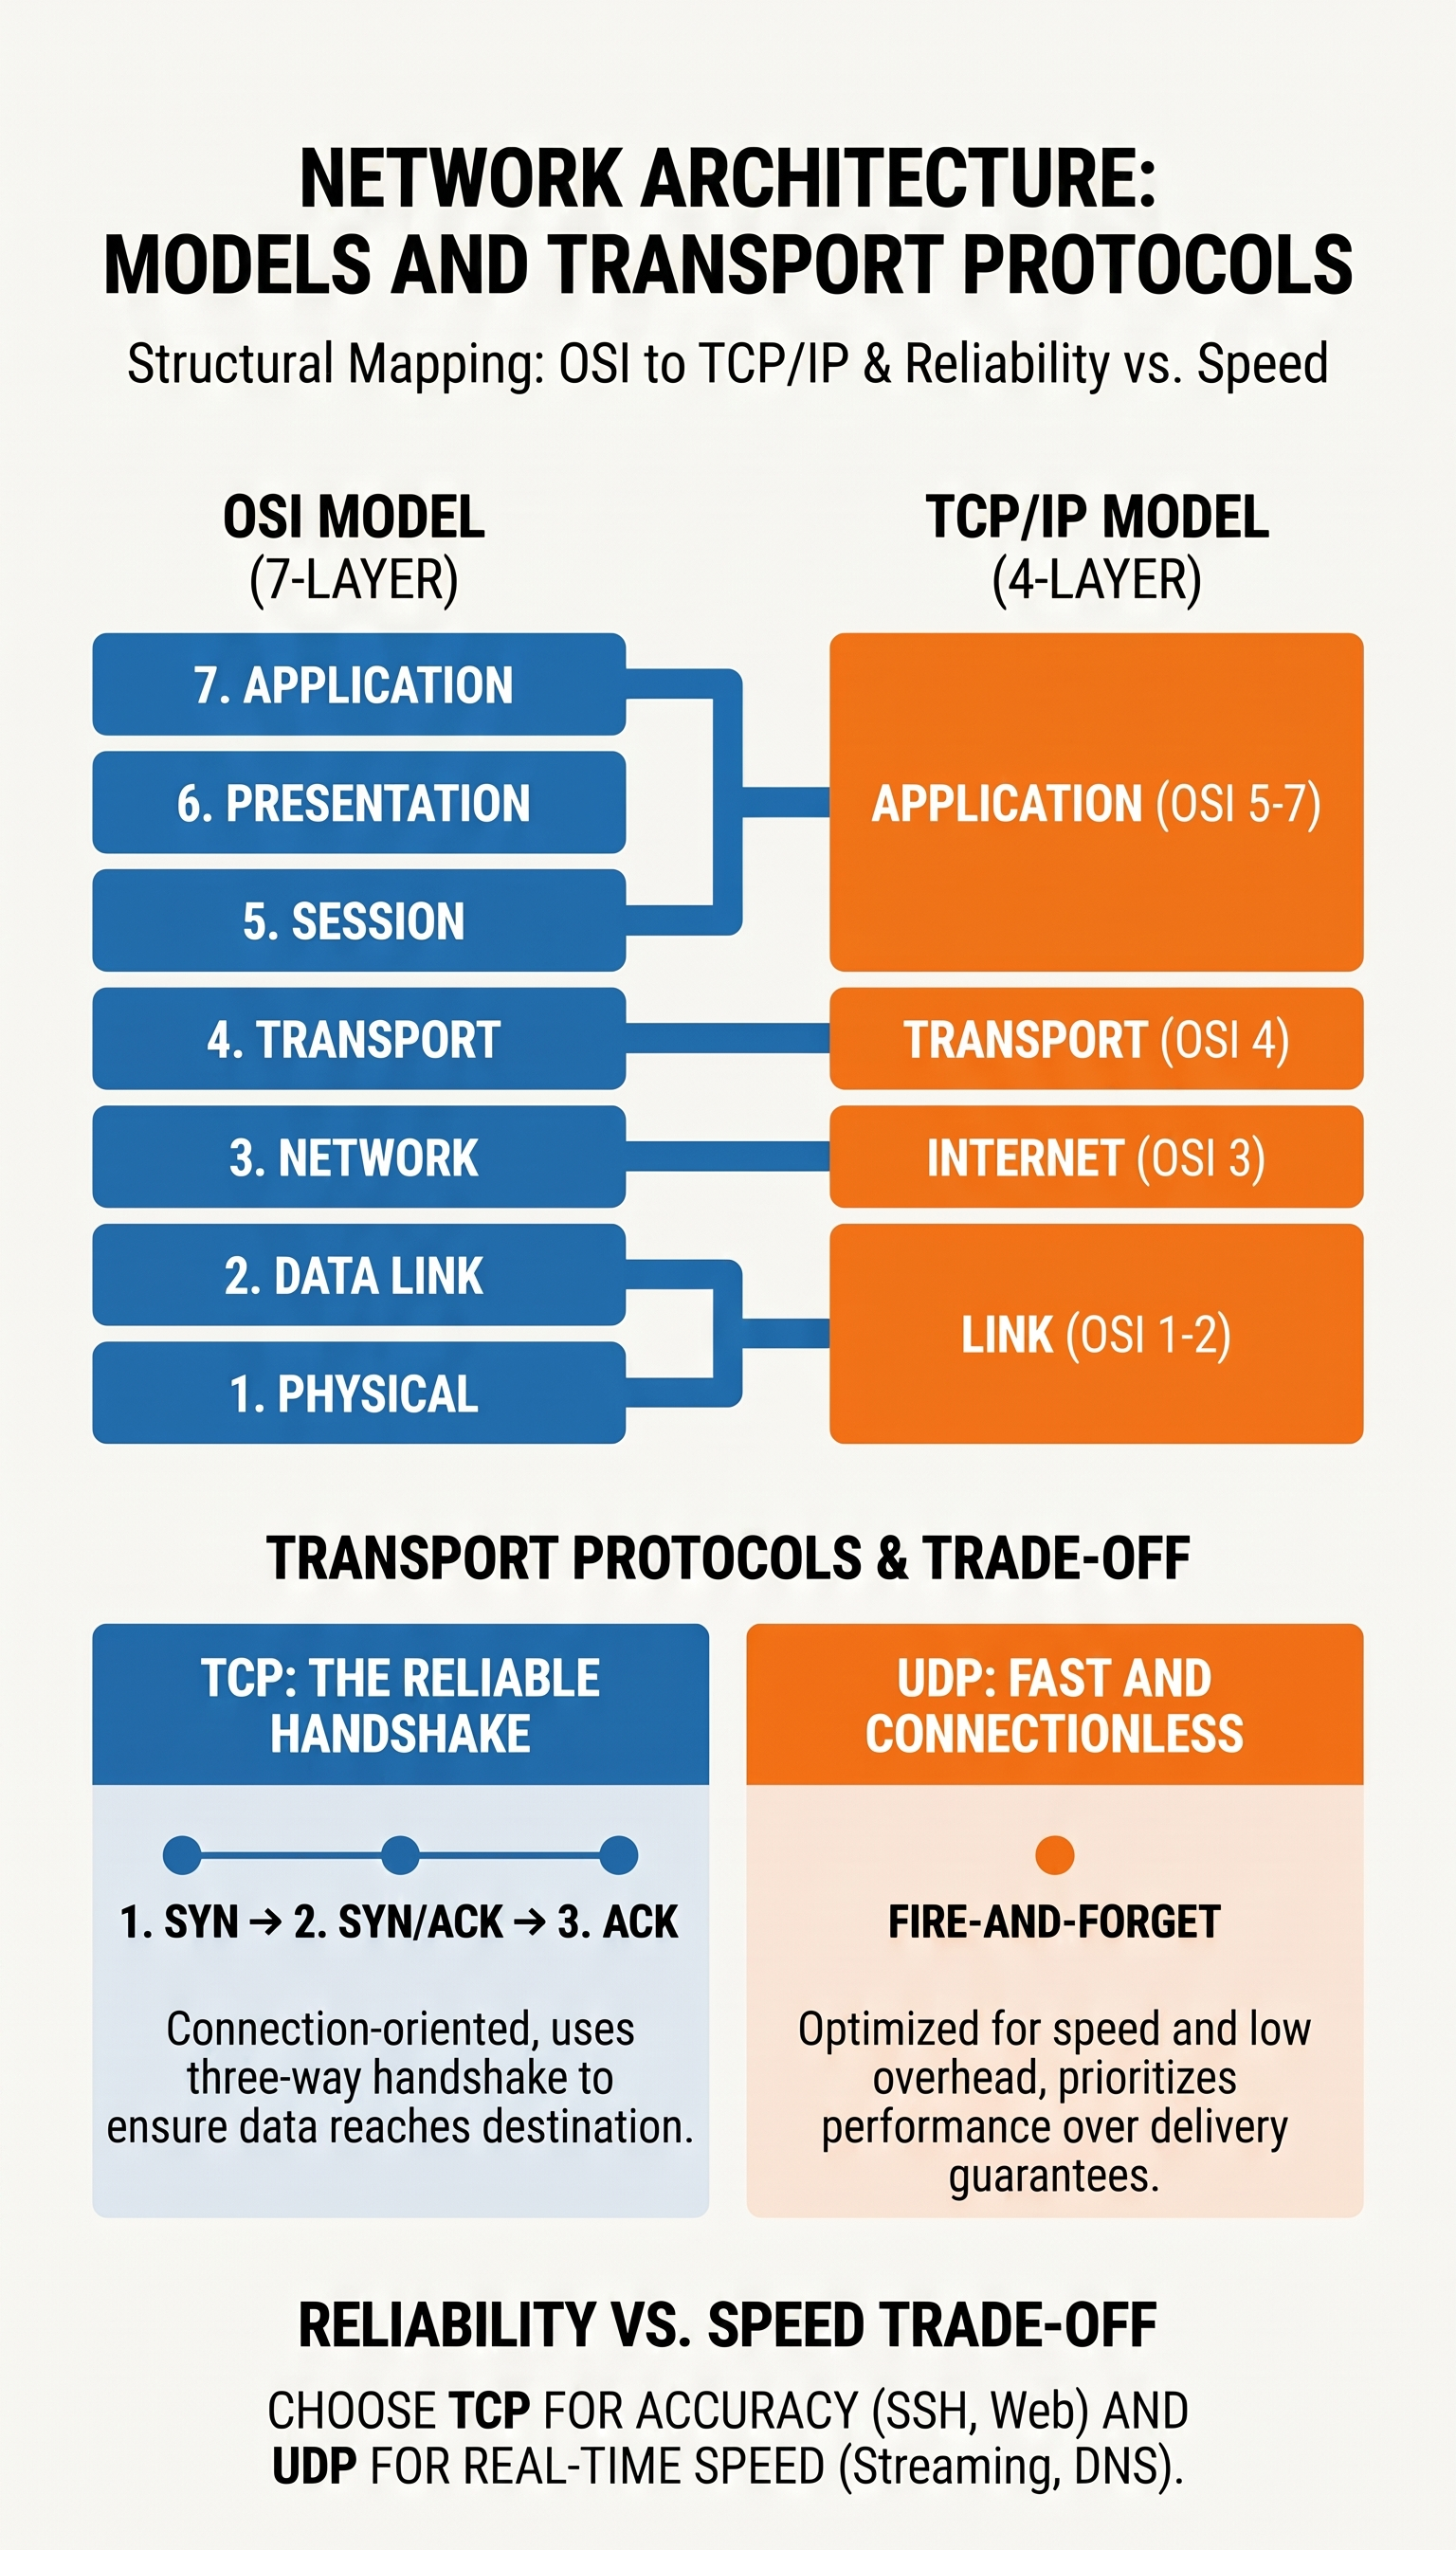
Think of the OSI model as the theory behind how everything works, whereas the TCP/IP model is more closely aligned with the actual functionality of networking.
Networking Models: Theory vs. Reality
To analyze network traffic effectively, you must understand the frameworks that govern how data moves. There are two primary models:
- OSI Model (7 Layers): Considered the “theory” behind networking, it breaks communication into seven strict functional chunks: Application, Presentation, Session, Transport, Network, Data-Link, and Physical.
- TCP/IP Model (4 Layers): This model is more closely aligned with actual functionality and common communication protocols. Its four layers (Application, Transport, Internet, and Link) map directly to the seven OSI layers.
Data Packaging: PDUs and Encapsulation
Data travels in units called Protocol Data Units (PDUs), which consist of control information and the data itself.
- Encapsulation: As data moves down the stack, each layer wraps the previous layer’s data in a “bubble” or header. This header contains vital operational flags, source/destination addresses, and ports.
- Analysis Note: In tools like Wireshark, you will see these layers in reverse order because the tool displays them as they are unencapsulated.
Addressing Mechanisms: How Packets Find Their Way
Network communication relies on specific addressing at different layers:
- MAC Addresses (Layer 2): A 48-bit hexadecimal address (e.g., seen on an en0 interface) used for host-to-host communication within a local broadcast domain.
- IPv4 (Layer 3): The current dominant 32-bit decimal standard (e.g., 192.168.86.243) used to route packets across network boundaries.
- IPv6: The 128-bit hexadecimal successor designed to solve address exhaustion. It offers built-in IPSec security and simplified headers for easier processing. It uses addressing types like Unicast (host-to-host), Multicast (one-to-many), and Anycast (one-to-one-of-many).
The Transport Layer: TCP vs. UDP
The Transport layer acts as a control hub, determining how traffic is encapsulated and reassembled.
- TCP (Transmission Control Protocol): Focused on completeness and reliability. It is connection-oriented and uses sequence numbers to ensure data arrives in order.
- Example: Used for SSH or commands like
sudo passwd user, where missing data could lead to corrupted settings.
- Example: Used for SSH or commands like
- UDP (User Datagram Protocol): A “fire and forget” protocol that prioritizes speed over quality.
- Example: Used for video streaming (where dropped pixels are better than buffering) and DNS requests for sites like inlanefreight.com.
The Lifecycle of a TCP Session
TCP ensures reliability through strictly managed sessions:
- The Three-Way Handshake: To establish a connection, a client (e.g., using random high port 57678) sends a SYN packet to a server (e.g., on web port 80). The server responds with SYN/ACK, and the client finishes with an ACK.
- Data Transfer: Once established, the session can stream data, with TCP acknowledging each chunk to ensure no data is lost.
- Graceful Teardown: When the transfer is finished, the FIN flag is used to signal termination. A properly terminated connection follows a specific pattern: FIN, ACK -> FIN, ACK -> ACK.
Upper Layer Protocols: Application and Service Management
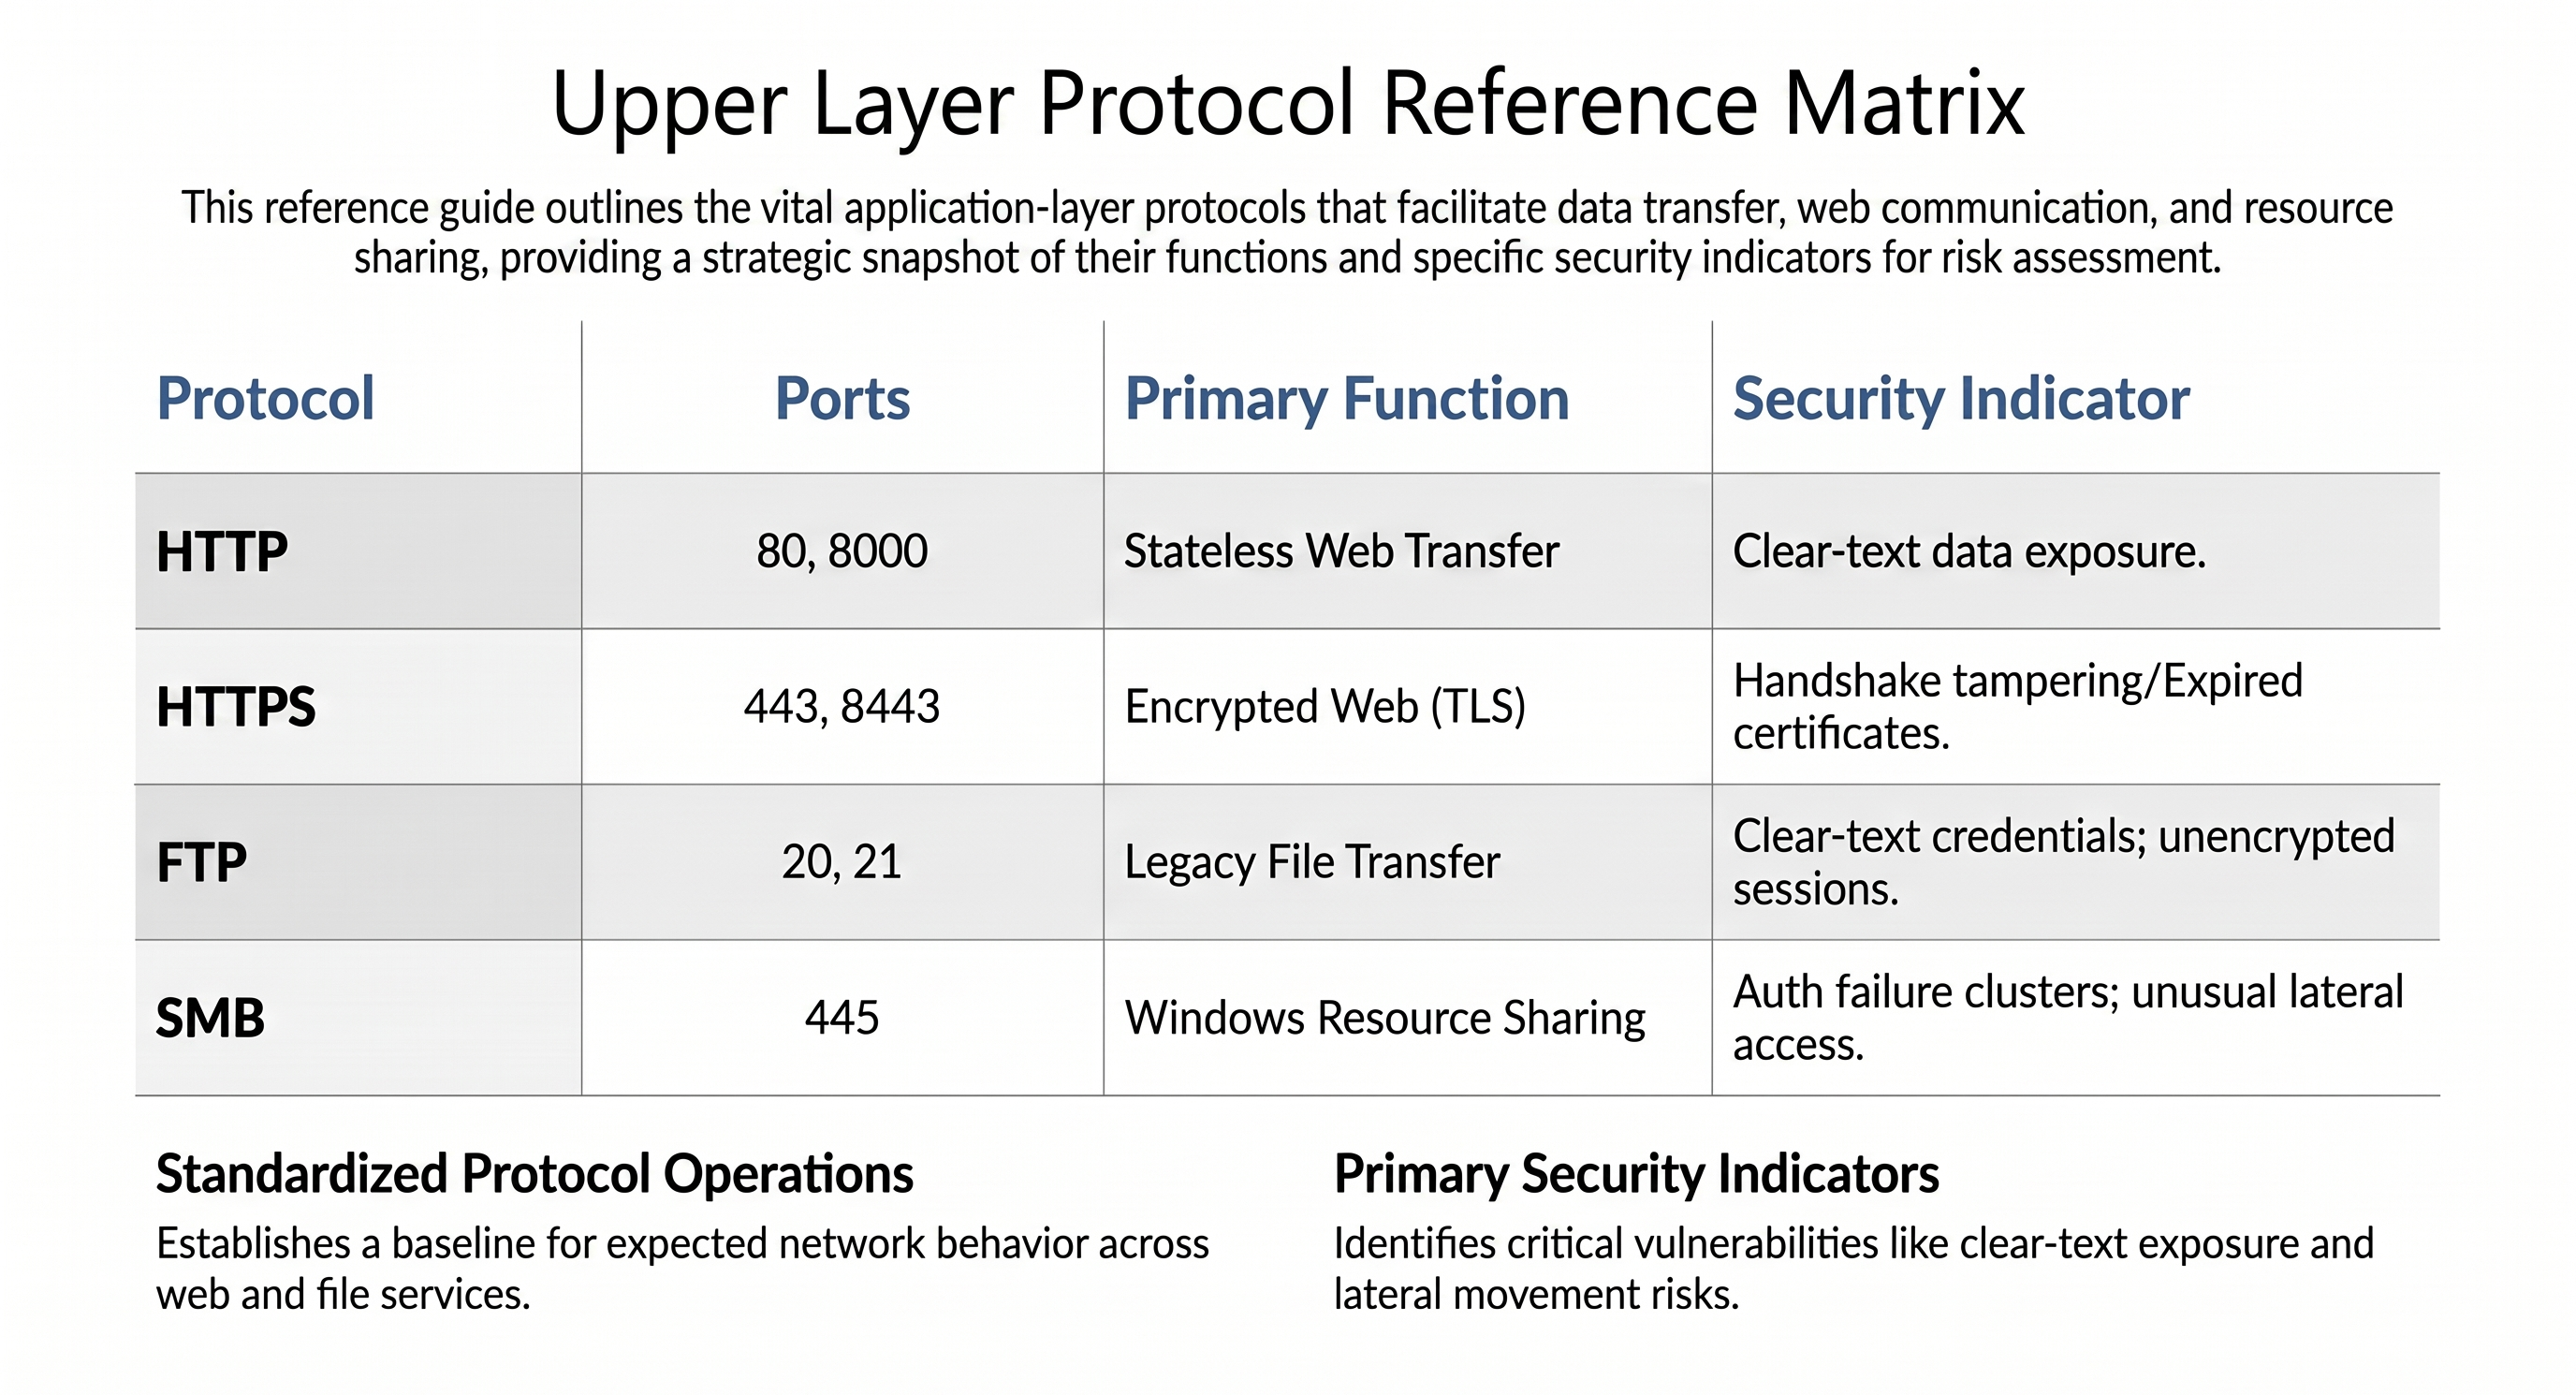
The Upper Layers (5-7) of the networking model manage the applications and services that enable user interaction and data transfer. While lower layers handle the delivery of packets, these protocols define how data is requested, secured, and shared across the network.
HTTP - the foundation of web communication. Hypertext Transfer Protocol (HTTP) is a stateless protocol that enables the transfer of clear-text data between a client and a server, typically over TCP ports 80 or 8000. To perform operations like fetching webpages or posting content, clients use specific HTTP Methods:
- Standard Requirements: To comply with standards, GET (requesting information) and HEAD (requesting server status without the message body) must always be supported.
- Data Management: POST is used to create “child entities” at a URI (like a comment on a post), while PUT creates or updates a specific object at a supplied URI. DELETE is used to remove resources.
- Specialized Functions: OPTIONS identifies supported methods, TRACE is used for remote diagnosis, and CONNECT is reserved for tunneling via proxies or firewalls.
HTTPS and the TLS handshake. HTTP Secure (HTTPS) uses ports 443 or 8443 to signal a secure connection. It protects traffic from Man-in-the-middle attacks by wrapping standard HTTP in Transport Layer Security (TLS) encryption. The TLS Handshake is the multi-step process that establishes this security:
- Hello Exchange: Client and server exchange “hello” messages to agree on connection parameters such as the cipher spec and compression algorithms.
- Secret Establishment: They exchange cryptographic parameters to create a premaster secret.
- Authentication: The parties exchange x.509 certificates to verify identities within the session.
- Master Secret Generation: A 48-byte master secret is generated from the premaster secret and random values to validate the session.
- Verification: Both parties verify that the other has calculated the same security parameters, ensuring the handshake occurred without tampering. Once finished, all subsequent data appears as encrypted Application Data.
FTP - specialized file transfer. File Transfer Protocol (FTP) is designed for quick data movement but is considered insecure. Modern browsers phased out support for it in 2020. It is unique because it utilizes two ports simultaneously: Port 21 for commands and Port 20 for data.
- Operational Modes: In Active Mode, the server dictates the data port, while in Passive Mode (PASV), the client initiates the connection - a necessity for users behind firewalls or NAT.
- Common Commands: Analysts track activity through commands like USER/PASS (login), LIST (view files), CWD (change directory), and RETR (retrieve file).
SMB - resource sharing and security indicators. Server Message Block (SMB) is primarily used in Windows environments to share printers and drives, typically over TCP port 445. Because it handles authentication and resource access, it is a frequent target for attackers. Analysts look for specific red flags in SMB traffic captures:
- Authentication Clusters: While occasional failures are normal, a large cluster of repeated logon failures often signals an attacker attempting to steal credentials.
- Lateral Movement: Attackers use stolen credentials to move between hosts. A major indicator of malicious activity is seeing a host access file shares on other hosts that they do not typically interact with.
Analysis: The NTA Process
That covered the protocol theory. The next section was the analysis process itself, how an investigation actually runs from capture to report.
Network Traffic Analysis is the detailed examination of network events to determine their origin and impact. It is a dynamic, repeatable process used to identify deviations from regular traffic, troubleshoot connectivity issues, and detect malicious activity - such as unauthorized remote communications via RDP, SSH, or Telnet. By breaking data into understandable chunks, analysts can provide the visibility needed to correct issues before or shortly after they occur.
Capture Methodologies: Passive vs. Active
The way you collect data depends on your network visibility and organizational permissions.
- Passive Traffic Capture: This method involves copying data without directly interacting with the packets. It typically requires a mirrored port (SPAN) on a switch or router and a network interface card (NIC) set to promiscuous mode.
- Active Traffic Capture: Also known as in-line capture, this requires a hands-on approach and a physical topology change. It involves placing a Network Tap or a host with multiple NICs directly in the path of the traffic, usually between layer-three routed segments.
Analysis Dependencies
Successful analysis requires more than just opening a tool. You must account for legal and technical requirements:
- Written Permission: Capturing data can be illegal or against policy in sensitive sectors like banking or healthcare. Always obtain written authorization first.
- Abundant Resources: Capture files (PCAPs) grow quickly. Your analysis host needs significant storage and processing power to parse data without crashing.
- Human Oversight: While automated tools like IDS/IPS or Splunk are good for alerting, the human eye remains the best resource for spotting sophisticated bypasses.
The Importance of the Network Baseline
Establishing a baseline of typical operational traffic is the most important step for an analyst. Without a “known-good” reference, identifying rogue assets or suspicious conversations becomes slow, time-consuming work.
- Filtering Out Noise: A baseline allows you to quickly strip away standard communications to focus purely on outliers.
- Detecting Anomalies: For example, web traffic (port 8080) or SMB (port 445) is normal between a host and a server. However, seeing two user PCs communicating directly over these ports is a major red flag for a potential breach.
- Top Talkers: Using modules like Wireshark’s “top talkers” helps you identify hosts sending unusual amounts of data compared to their historical average.
The Traffic Analysis Workflow: From Detection to Resolution
Network traffic analysis is rarely a linear process. It is a dynamic, cyclical workflow influenced by whether you are troubleshooting a network error or hunting for a malicious breach. To be effective, an analyst must transition through four distinct stages of analysis to move from a raw packet capture to a finalized security prescription.
Phase 1 - Descriptive Analysis (defining the scope). Before opening a capture tool, you must define the characteristics of the data set to avoid collection errors and scope creep.
- Identify the Issue: Is this a suspected breach or a networking performance issue?
- Define the Target: Specify the affected networks, hosts, and protocols (e.g., the
192.168.100.0/24subnet using HTTP and FTP). - Set Timeframes: Establish a strict window for the investigation (e.g., the last 48 hours plus a two-hour buffer for live monitoring).
Phase 2 - Diagnostic Analysis (finding the cause). This stage involves capturing live traffic and correlating historical data to find the reasons behind a network event.
- Capture and Filter: Plug into a link with access to the target subnet and pull historical PCAP or netflow data from your SIEM.
- Clear the Noise: Filter out any packets that match your established common baseline. Focus only on the outliers relevant to your scope, such as
GETrequests for specific suspicious filenames. - Deep Inspection: Use specific protocol filters - like
ftp-datato reconstruct transferred files orhttp.request.method == "GET"to identify who acquired potentially malicious executables.
Phase 3 - Predictive Analysis (forecasting impact). By evaluating the results of your diagnostic work, you can identify trends and detect deviations that signal future probabilities.
- Note-taking and Mapping: Document every suspicious host, timestamp, and packet number involved in the conversation.
- Summarize Findings: Provide a clear, concise report for leadership so they can decide on immediate actions, such as host quarantine or full-scale incident response.
Phase 4 - Prescriptive Analysis (the solution). The culmination of the workflow is prescribing the final solution to prevent the issue from recurring.
- Take Action: Execute the decisions made during the predictive phase to eliminate the problem.
- Lessons Learned: Reflect on the process. Document what actions failed and what could be improved to strengthen future workflows.
Some Approaches to Start
To speed up your analysis, keep these three strategic components in mind:
- Standard Protocols First: Start by clearing out common traffic like HTTP/S, FTP, and E-mail. Once the bulk is cleared, check for unauthorized use of management protocols like SSH, RDP, or Telnet.
- Watch Host-to-Host Traffic: In a standard environment, user hosts rarely talk directly to each other. Be highly suspicious of any internal peer-to-peer traffic that bypasses infrastructure like domain controllers or file shares.
- Identify Patterns and Unique Events: Look for “beacons” - specific hosts checking in with the internet at the exact same time daily - which often indicates a Command and Control (C2) profile. Similarly, watch for unique User-Agent strings or random ports bound only once or twice on a host.
Tcpdump
With the process down, the module moved into the tools. First up was tcpdump on the command line.
Tcpdump is a terminal-based packet sniffer that captures and interprets data frames directly from a network interface. Because it requires direct hardware access, you must have root or administrator privileges, typically using sudo, to run the tool.
The first tcpdump task was just basic practice of the command reference below, so I moved through it quickly. The takeaways I kept from it: it must be run with root/sudo privileges (verify with which tcpdump and tcpdump --version), it puts the interface in promiscuous mode so it sees all packets on the local segment, -nn prevents DNS resolution delays, -X shows contents in Hex and ASCII for reading clear-text data, and -c / -w manage how much you capture and where it goes.
Tcpdump Command Reference
| Switch | Logic / Result | When to Use |
|---|---|---|
-D |
Displays all available network interfaces. | Use first to identify which interface (e.g., eth0) to listen on. |
-i [int] |
Selects a specific interface to sniff. | Essential for targeting a specific network path or using “any” for all interfaces. |
-nn |
Disables name and port resolution. | Prevents DNS lookup delays and ensures you see raw IP addresses and port numbers. |
-e |
Includes Ethernet headers in the output. | Required when you need to see MAC addresses for Layer 2 troubleshooting. |
-X / -XX |
Shows packet contents in Hex and ASCII. | Used for reading clear-text data, such as login credentials or HTTP headers. |
-v, -vv, -vvv |
Increases output verbosity. | Used to see detailed header information like TTL, flags, and options. |
-c [num] |
Grabs a specific number of packets and quits. | Use to take a quick “snapshot” without overwhelming the terminal. |
-w [file] |
Writes raw traffic to a PCAP file. | Standard for saving evidence or performing deep analysis in Wireshark later. |
-r [file] |
Reads traffic from a saved PCAP file. | Used to re-analyze captured data. Switches can be reapplied to change the view. |
Chaining for efficiency. You can chain and combine switches as needed to craft a comprehensive live view. A common “all-in-one” command for deep inspection is sudo tcpdump -i [interface] -nnvXX, which combines interface selection, raw numbering, high verbosity, and full hex/ASCII payload display.
Essential notes:
- Privileged Access: Tcpdump requires root privileges to access the network hardware.
- Promiscuous Mode: The tool uses an interface in promiscuous mode, allowing it to see all packets on the local segment, not just those destined for your host.
- Storage Management: When writing to a file (
-w), be mindful of disk space. Large network segments can fill storage quickly. - Terminal Silence: When writing traffic to a file, the output will not scroll in the terminal. All data is redirected to the specified file.
- Verification: You can use
which tcpdumpto locate the package ortcpdump --versionto validate your current installation.
Advanced Tcpdump Filtering: BPF Syntax
By utilizing Berkeley Packet Filter (BPF) syntax, analysts can precisely define what data is printed to the output or written to a file. This reduces disk space requirements and ensures the buffer processes data more efficiently.
Core filter reference - these filters inspect protocol headers and match specific values to isolate relevant traffic:
| Filter | Result / Logic | Practical Example |
|---|---|---|
host |
Bi-directional filter for a specific IP. | sudo tcpdump -i eth0 host 172.16.146.2 |
src / dst |
Modifiers to designate direction. | sudo tcpdump -i eth0 src host 172.16.146.2 |
net |
Filters for a specific network range. | sudo tcpdump -i eth0 dst net 172.16.146.0/24 |
proto |
Filters by name or protocol number. | sudo tcpdump -i eth0 proto 17 (UDP) |
portrange |
Identifies traffic within a specific range. | sudo tcpdump -i eth0 portrange 0-1024 |
less / greater |
Filters packets by size (in bytes). | sudo tcpdump -i eth0 greater 500 |
Logical operators - building complex queries. To find specific anomalies, you must often concatenate multiple requirements using logical operators.
- AND (
andor&&): The packet must meet all criteria. For instance,host 192.168.0.1 and port 23will only show Telnet traffic for that specific host. - OR (
oror||): Matches if either condition is met. This is useful for monitoring multiple variables, such asicmp or host 172.16.146.1. - NOT (
notor!): Negates a condition. Usingnot icmpstrips away common “noise” to reveal other protocols like HTTPS or ARP.
Power user techniques:
- Live String Scraping: Use the
-lswitch for line buffering. This allows you to pipe the output to grep to search for keywords like email addresses in real-time. Example:sudo tcpdump -Ar [file] -l | grep 'mailto:*'. - Bitwise Flag Hunting: You can hunt for specific TCP flags by counting bytes in the header. To find the SYN flag, look at the 13th byte and check if the 2nd bit is “on”. Example:
tcpdump -i eth0 'tcp[13] & 2 != 0'.
Why you might “miss” data. Understanding the nuances of filtering prevents the accidental loss of evidence.
- Directional Blind Spots: If you use a modifier like
src port 80, you will only see the server’s response. You will miss the client side of the conversation entirely. - Permanent Data Loss: Applying filters during a live capture (Pre-Capture) will permanently drop any traffic that doesn’t match. Only use this for troubleshooting. For investigations, use Post-Capture processing on a saved PCAP.
- Sequence Number Mismatches: Tcpdump defaults to relative sequence numbers. If you are trying to match packets against a third-party log, you may “miss” the connection unless you use the
-Sswitch to display absolute sequence numbers. - Filter Strictness: When using
AND, if a packet fails even one requirement, it is excluded. If your results are empty, your filter may be too specific.
Lab: Interrogating Network Traffic With Capture and Display Filters
This task was about using tcpdump capture and display filters to analyze a PCAP file. The main goal was to understand what type of traffic was present, identify the DNS and HTTP/HTTPS activity, and determine which hosts were acting as clients and servers.
I started broad by counting packets and identifying protocols first. After that, I narrowed the view using filters for ports, conversations, DNS, HTTP, and TCP handshakes.
1. Starting with a basic packet count. I first counted the total number of packets in the capture to get a baseline before applying filters.
tcpdump -nr TCPDump-lab-2.pcap | wc -l
I used -r because I was reading from a PCAP file, and -n so IP addresses and ports stayed numeric instead of being resolved to names. This gave me a simple starting point for the rest of the analysis.
2. Breaking down the traffic by protocol. After getting the baseline, I wanted to see what type of traffic was inside the PCAP. I counted TCP, UDP, ICMP, and ARP traffic separately.
tcpdump -nr TCPDump-lab-2.pcap tcp | wc -l    # 466
tcpdump -nr TCPDump-lab-2.pcap udp | wc -l    # 69
tcpdump -nr TCPDump-lab-2.pcap icmp | wc -l   # 0
tcpdump -nr TCPDump-lab-2.pcap arp | wc -l    # 0
From this, I saw that the capture was mostly TCP traffic, with some UDP traffic. There was no ICMP or ARP traffic in this PCAP. This told me the capture was mainly IP-based traffic, and most of the useful analysis would be around TCP, UDP, DNS, and web traffic.
3. Checking common service ports. Next, I checked common service ports to understand what application protocols were present.
tcpdump -nr TCPDump-lab-2.pcap port 53 -c 10
tcpdump -nr TCPDump-lab-2.pcap port 80 -c 10
tcpdump -nr TCPDump-lab-2.pcap port 443 -c 10
This helped confirm that the traffic included:
53   DNS
80   HTTP
443  HTTPS
At this point, I knew the PCAP had DNS lookups and web traffic.
4. Ranking destination ports. After checking the common ports manually, I used a longer pipeline to extract destination ports from the IP packets and rank them by frequency.
tcpdump -nr TCPDump-lab-2.pcap 'ip' | grep ' > ' | awk '{print $5}' | rev | cut -d. -f1 | rev | tr -d ':' | sort | uniq -c | sort -rn | head -20
This command reads IP packets, extracts the destination field, isolates the destination port, removes the colon, counts repeated ports, and ranks the most common ones. The logic here was to separate actual service ports like 53, 80, and 443 from high-numbered ephemeral ports. The low-numbered ports helped identify services, while the high-numbered ports were mostly temporary client-side ports.
5. Identifying conversations. Once I understood the traffic types and ports, I looked at which hosts were communicating with each other.
tcpdump -nr TCPDump-lab-2.pcap 'ip' | awk '{print $3, $5}' | awk -F'.' '{print $1"."$2"."$3"."$4, $5"."$6"."$7"."$8}' | sort | uniq -c | sort -rn | head
This helped me move from just looking at protocols and ports to looking at conversations between systems. The question changed from “what traffic exists?” to “who is talking to whom?”
6. Finding the first full TCP three-way handshake. Next, I focused on TCP handshakes. I filtered for SYN, SYN-ACK, and ACK packets.
tcpdump -nS -r TCPDump-lab-2.pcap 'tcp[13]==2 or tcp[13]==18 or tcp[13]==16' -c 20
The flag values I used were:
tcp[13]==2    SYN
tcp[13]==18   SYN-ACK
tcp[13]==16   ACK
I used -S to show absolute TCP sequence numbers. From this, I identified the first full TCP handshake as Client port 43806 -> Server 95.216.26.30 port 80, so the answer to the lab question was:
80 43806
The low port 80 belonged to the server, and the high port 43806 was the client ephemeral port.
7. Listing completed handshakes. To make the handshake analysis cleaner, I used this command to list completed handshakes.
tcpdump -nS -r TCPDump-lab-2.pcap 'tcp[13]==2 or tcp[13]==18 or tcp[13]==16' | awk '
{
  for(i=1;i<=NF;i++) if($i=="Flags"){f=$(i+1); gsub(/[\[\],]/,"",f)}
  src=$3; dst=$5; gsub(/:$/,"",dst)
  if(f=="S")  syn[src" "dst]=1
  if(f=="S.") synack[dst" "src]=1
  if(f=="."){ key=src" "dst; if(syn[key] && synack[key] && !done[key]){ done[key]=1; print "COMPLETED:", key } }
}'
This helped me confirm completed connections instead of only looking at individual SYN or ACK packets.
8. Identifying servers and clients. To identify servers, I looked for systems sending SYN-ACK packets. In a normal TCP handshake, the server responds with SYN-ACK.
tcpdump -nr TCPDump-lab-2.pcap 'tcp[13]==18' | awk '{print $3}' | sort | uniq -c | sort -rn
To identify clients, I looked for systems sending the initial SYN packets.
tcpdump -nr TCPDump-lab-2.pcap 'tcp[13]==2' | awk '{print $3}' | awk -F. '{print $1"."$2"."$3"."$4}' | sort | uniq -c | sort -rn
The logic was that the client starts the connection with a SYN from a high ephemeral port, and the server replies with a SYN-ACK from a service port like 80, 443, or 53. So I used TCP flags, packet direction, and port numbers to understand which side was the client and which side was the server.
9. Timestamp of the first established conversation. After identifying the first full handshake, I used this query to print the timestamp of the first established conversation.
tcpdump -nS -r TCPDump-lab-2.pcap 'tcp[13]==2 or tcp[13]==18 or tcp[13]==16' 2>/dev/null | awk '
{
  for(i=1;i<=NF;i++) if($i=="Flags"){f=$(i+1); gsub(/[\[\],]/,"",f)}
  ts=$1; src=$3; dst=$5; gsub(/:$/,"",dst)
  if(f=="S")  syn[src" "dst]=1
  if(f=="S.") synack[dst" "src]=1
  if(f=="."){ key=src" "dst; if(syn[key] && synack[key] && !done[key]){ print ts, key; exit } }
}'
The first established conversation was:
11:34:01.401270
172.16.146.2:43806 -> 95.216.26.30:80
10. Finding apache.org from DNS responses. Next, I moved into DNS analysis. I wanted to confirm what IP addresses were returned for apache.org.
tcpdump -nvvr TCPDump-lab-2.pcap 'udp port 53' | grep -i apache
The DNS A record response showed:
apache.org = 95.216.26.30
apache.org = 207.244.88.140
This connected back to the first TCP conversation, because the first established connection went to 95.216.26.30, which was one of the IPs returned for apache.org.
11. Confirming the protocol used in the first conversation. To isolate the first conversation, I filtered on the server IP and the client ephemeral port.
tcpdump -nr TCPDump-lab-2.pcap 'host 95.216.26.30 and port 43806' -c 5
Since the server side was using port 80, the protocol used in the first conversation was HTTP. So the flow was: DNS resolved apache.org to 95.216.26.30, then the client 172.16.146.2 connected to 95.216.26.30 over HTTP port 80.
12. Filtering only DNS traffic. After that, I filtered out everything except DNS traffic.
tcpdump -nr TCPDump-lab-2.pcap 'udp port 53'
This cleared out the TCP and web traffic and left only DNS queries and responses. To identify the DNS server, I looked for the system answering on port 53.
tcpdump -nr TCPDump-lab-2.pcap 'udp port 53' | awk '$3 ~ /\.53$/ {print $3}' | sort -u
The DNS server for this network segment was 172.16.146.1.
13. Finding requested domain names. To list the domain names requested in the PCAP, I extracted the DNS query names.
tcpdump -nr TCPDump-lab-2.pcap 'udp port 53' | awk '{for(i=1;i<=NF;i++) if($i=="A?"||$i=="AAAA?") print $(i+1)}' | sort -u
The requested domains included:
apache.org
www.apachecon.com
www.google.com
clients1.google.com
cse.google.com
www.googleapis.com
safebrowsing.googleapis.com
fonts.googleapis.com
fonts.gstatic.com
ocsp.pki.goog
www.youtube.com
i.ytimg.com
yt3.ggpht.com
googleads.g.doubleclick.net
static.doubleclick.net
ocsp.sectigo.com
This showed the name resolution activity that supported the later web connections.
14. Checking DNS record types. To identify DNS record types, I used verbose output and searched for record keywords.
tcpdump -nvvr TCPDump-lab-2.pcap 'udp port 53' | grep -oE '\b(A|AAAA|CNAME|SOA|NS|MX|PTR|TXT)\b' | sort | uniq -c | sort -rn
The record types seen were:
A       IPv4 address
AAAA    IPv6 address
CNAME   alias record
SOA     Start of Authority
The A records provided IPv4 addresses, which is how the client got IPs like 95.216.26.30 for apache.org.
15. Filtering HTTP traffic. After DNS, I looked at HTTP traffic by filtering on TCP port 80 and printing the payload in ASCII.
tcpdump -nr TCPDump-lab-2.pcap 'tcp port 80' -A 2>/dev/null | grep -E 'GET |POST |Host:'
From the readable HTTP traffic, I mainly saw OCSP certificate-checking requests:
POST /gts1o1core to ocsp.pki.goog
POST / to ocsp.sectigo.com
Most actual web page traffic was on HTTPS port 443, so the contents were encrypted and not readable in plain text from tcpdump output.
16. Finding the most common HTTP request method. To count HTTP methods, I used:
tcpdump -nr TCPDump-lab-2.pcap 'tcp port 80' -A 2>/dev/null | grep -oE '(GET|POST|HEAD|PUT|DELETE|OPTIONS) /' | sort | uniq -c | sort -rn
The most common HTTP method was POST. In this PCAP, POST was the only visible HTTP method from the readable HTTP traffic.
17. Finding the most common HTTP response. To count HTTP response codes, I used:
tcpdump -nr TCPDump-lab-2.pcap 'tcp port 80' -A 2>/dev/null | grep -oE 'HTTP/1\.[01] [0-9]{3}[^"]*' | sort | uniq -c | sort -rn
The most common HTTP response was HTTP/1.1 200 OK. There were 14 200 OK responses.
18. Identifying the webserver in the first conversation. Finally, I checked the HTTP server header.
tcpdump -nr TCPDump-lab-2.pcap 'tcp port 80' -A 2>/dev/null | grep -i 'Server:'
The result showed Server: Apache. So the webserver in the first conversation was running Apache. One thing I noticed was that the server header showed Apache but it did not expose a version number - so I could identify the application as Apache, but I could not identify the exact version from this header alone.
Final summary. In this lab, I started with a broad view of the PCAP and then narrowed down step by step. The flow I followed was:
1. Count total packets
2. Count traffic by protocol
3. Check common ports
4. Rank destination ports
5. Identify conversations
6. Find the first full TCP handshake
7. Identify clients and servers
8. Analyze DNS traffic
9. Find requested domains and DNS records
10. Analyze HTTP traffic
11. Identify HTTP methods, responses, and server headers
The main findings were:
DNS server: 172.16.146.1
First full TCP handshake: 172.16.146.2:43806 -> 95.216.26.30:80
Client port: 43806
Server port: 80
First established timestamp: 11:34:01.401270
apache.org IPs: 95.216.26.30 and 207.244.88.140
Protocol in first conversation: HTTP
Webserver: Apache
Most common HTTP method: POST
Most common HTTP response: HTTP/1.1 200 OK
Analysis questions I kept in mind. While going through the PCAP, I tried to avoid jumping directly into one packet. I used a few basic questions to guide the analysis and keep the workflow organized (this was also provided in the content, but I followed it and used AI to help me brainstorm and navigate the more complex tcpdump commands):
What protocols and ports are present in the capture?
Are there multiple conversations happening, or mostly one main flow?
Which hosts appear more often, and how many unique systems are involved?
What is the first TCP conversation that fully establishes a connection?
What traffic can I filter out so the output becomes easier to read?
Which hosts are acting like servers based on well-known ports such as 53, 80, or 443?
What DNS records, HTTP methods, or response codes are visible in the traffic?
These questions helped me move from a broad view of the capture to a more focused analysis. Instead of only reading packet lines one by one, I used filters to reduce noise and answer one question at a time.
Wireshark
That closed out the tcpdump half. From here the module switched to Wireshark for the rest of the labs.
Network traffic analysis often requires choosing the right tool for the environment, whether you are working in a full desktop GUI or a headless terminal. Wireshark and its counterparts provide the deep packet inspection capabilities needed to dissect hundreds of protocols and even decrypt secure traffic like IPsec or SSL/TLS.
Choosing Your Interface: GUI, CLI, or TUI
Depending on your access level and machine type, you have three primary ways to interact with network data:
- Wireshark (GUI): The feature-rich graphical option, ideal for deep analysis in a desktop environment.
- TShark (CLI): A purpose-built terminal tool based on Wireshark. It is perfect for automation or machines without a desktop environment and shares the same core features and syntax as its GUI counterpart.
- Termshark (TUI): A Text-based User Interface that provides a “Wireshark-like” experience directly in the terminal window, allowing for visual navigation without a GUI.
TShark command-line essentials. TShark works well for quick captures and filtering using BPF (Berkeley Packet Filter) syntax. Key switches for standard operations include:
-D: Lists all available interfaces to capture from.-i [interface]: Selects a specific interface (e.g.,eth0oren0).-w [file.pcap]: Writes the captured traffic directly to a file.-r [file.pcap]: Reads and analyzes a previously saved capture file.-f: Applies a capture filter to limit what data is written to the disk.
Inside the Wireshark GUI - the three-pane view. The Wireshark interface is divided into three main sections to help analysts drill down into data efficiently:
- Packet List (Top): Displays a summary of each packet, including the order of arrival, time, source/destination IPs, and the protocol used.
- Packet Details (Middle): Provides a breakdown of the packet based on the OSI model. It shows encapsulation in reverse order, with lower layers (like Ethernet) at the top and higher layers (like HTTP) at the bottom.
- Packet Bytes (Bottom): Displays the raw data in Hex and ASCII. Selecting a field in the Details pane highlights the corresponding bits in this window.
Capture vs. display filters. Effective analysis requires knowing when to filter traffic to avoid being overwhelmed by data.
- Capture Filters (Pre-capture): Applied before the capture starts using BPF syntax (e.g.,
host 10.1.1.1orport 80). These are essential for reducing noise and saving disk space because any traffic not meeting the criteria is dropped. - Display Filters (Post-capture): Applied while a capture is running or after it has stopped. These use Wireshark’s proprietary syntax (e.g.,
ip.addr == 1.1.1.1ortcp.port == 443). They do not delete data. They simply hide it from view, allowing for granular exploration.
One thing to remember: filtering for a port (like port 80) is not the same as filtering for a protocol (like HTTP). Ports are mere guidelines. A protocol filter looks for specific markers like GET or POST requests, regardless of which port is being used.
Familiarity With Wireshark
Wireshark can analyze everything from industrial SCADA traffic to malware, but its most common use is simple validation of network health. This lab just covered a basic flow to get familiar with Wireshark. I knew most of it, so I went through it fast. It covers:
- Interface Selection: Choose your active network card (e.g.,
eth0or your Wi-Fi card) from the home screen or the Capture tab. - Apply a Capture Filter: To keep the results “clutter-free,” use a filter like
host X.X.X.X(your IP) to isolate traffic only from the machine in question. - Generate Traffic: Open a browser and navigate to sites like
pepsi.comorapache.orgto fill your capture window with data for analysis. - Analyze the Results: Once the traffic is captured, focus on three specific data points to characterize the activity:
- Session Density: Are there an unusually high number of connections being established?
- Application Protocols: Which protocols are actually being used?
- Clear Text Visibility: Can you discern sensitive information in the raw output?
It is a basic flow, but it takes you from theory to actually capturing and reading traffic on a live network. The Statistics tab alone tells you a lot - traffic volume gives you a good sense of what’s happening.
Wireshark Advanced Usage
After that quick lab, the next section covered the advanced side.
While basic filtering is essential, advanced traffic analysis uses Wireshark’s built-in plugins to automate reporting and data recovery. These capabilities allow analysts to move from examining individual packets to reconstructing entire user sessions and extracting transferred files.
The Statistics and Analyze tabs. These two tabs house a variety of plugins that provide high-level insights and automated troubleshooting.
- Statistics Tab: This provides “top-down” reports on the entire capture. It identifies top talkers (the most active IP addresses), summarizes specific conversations, and generates a protocol hierarchy to show exactly which protocols are consuming network bandwidth.
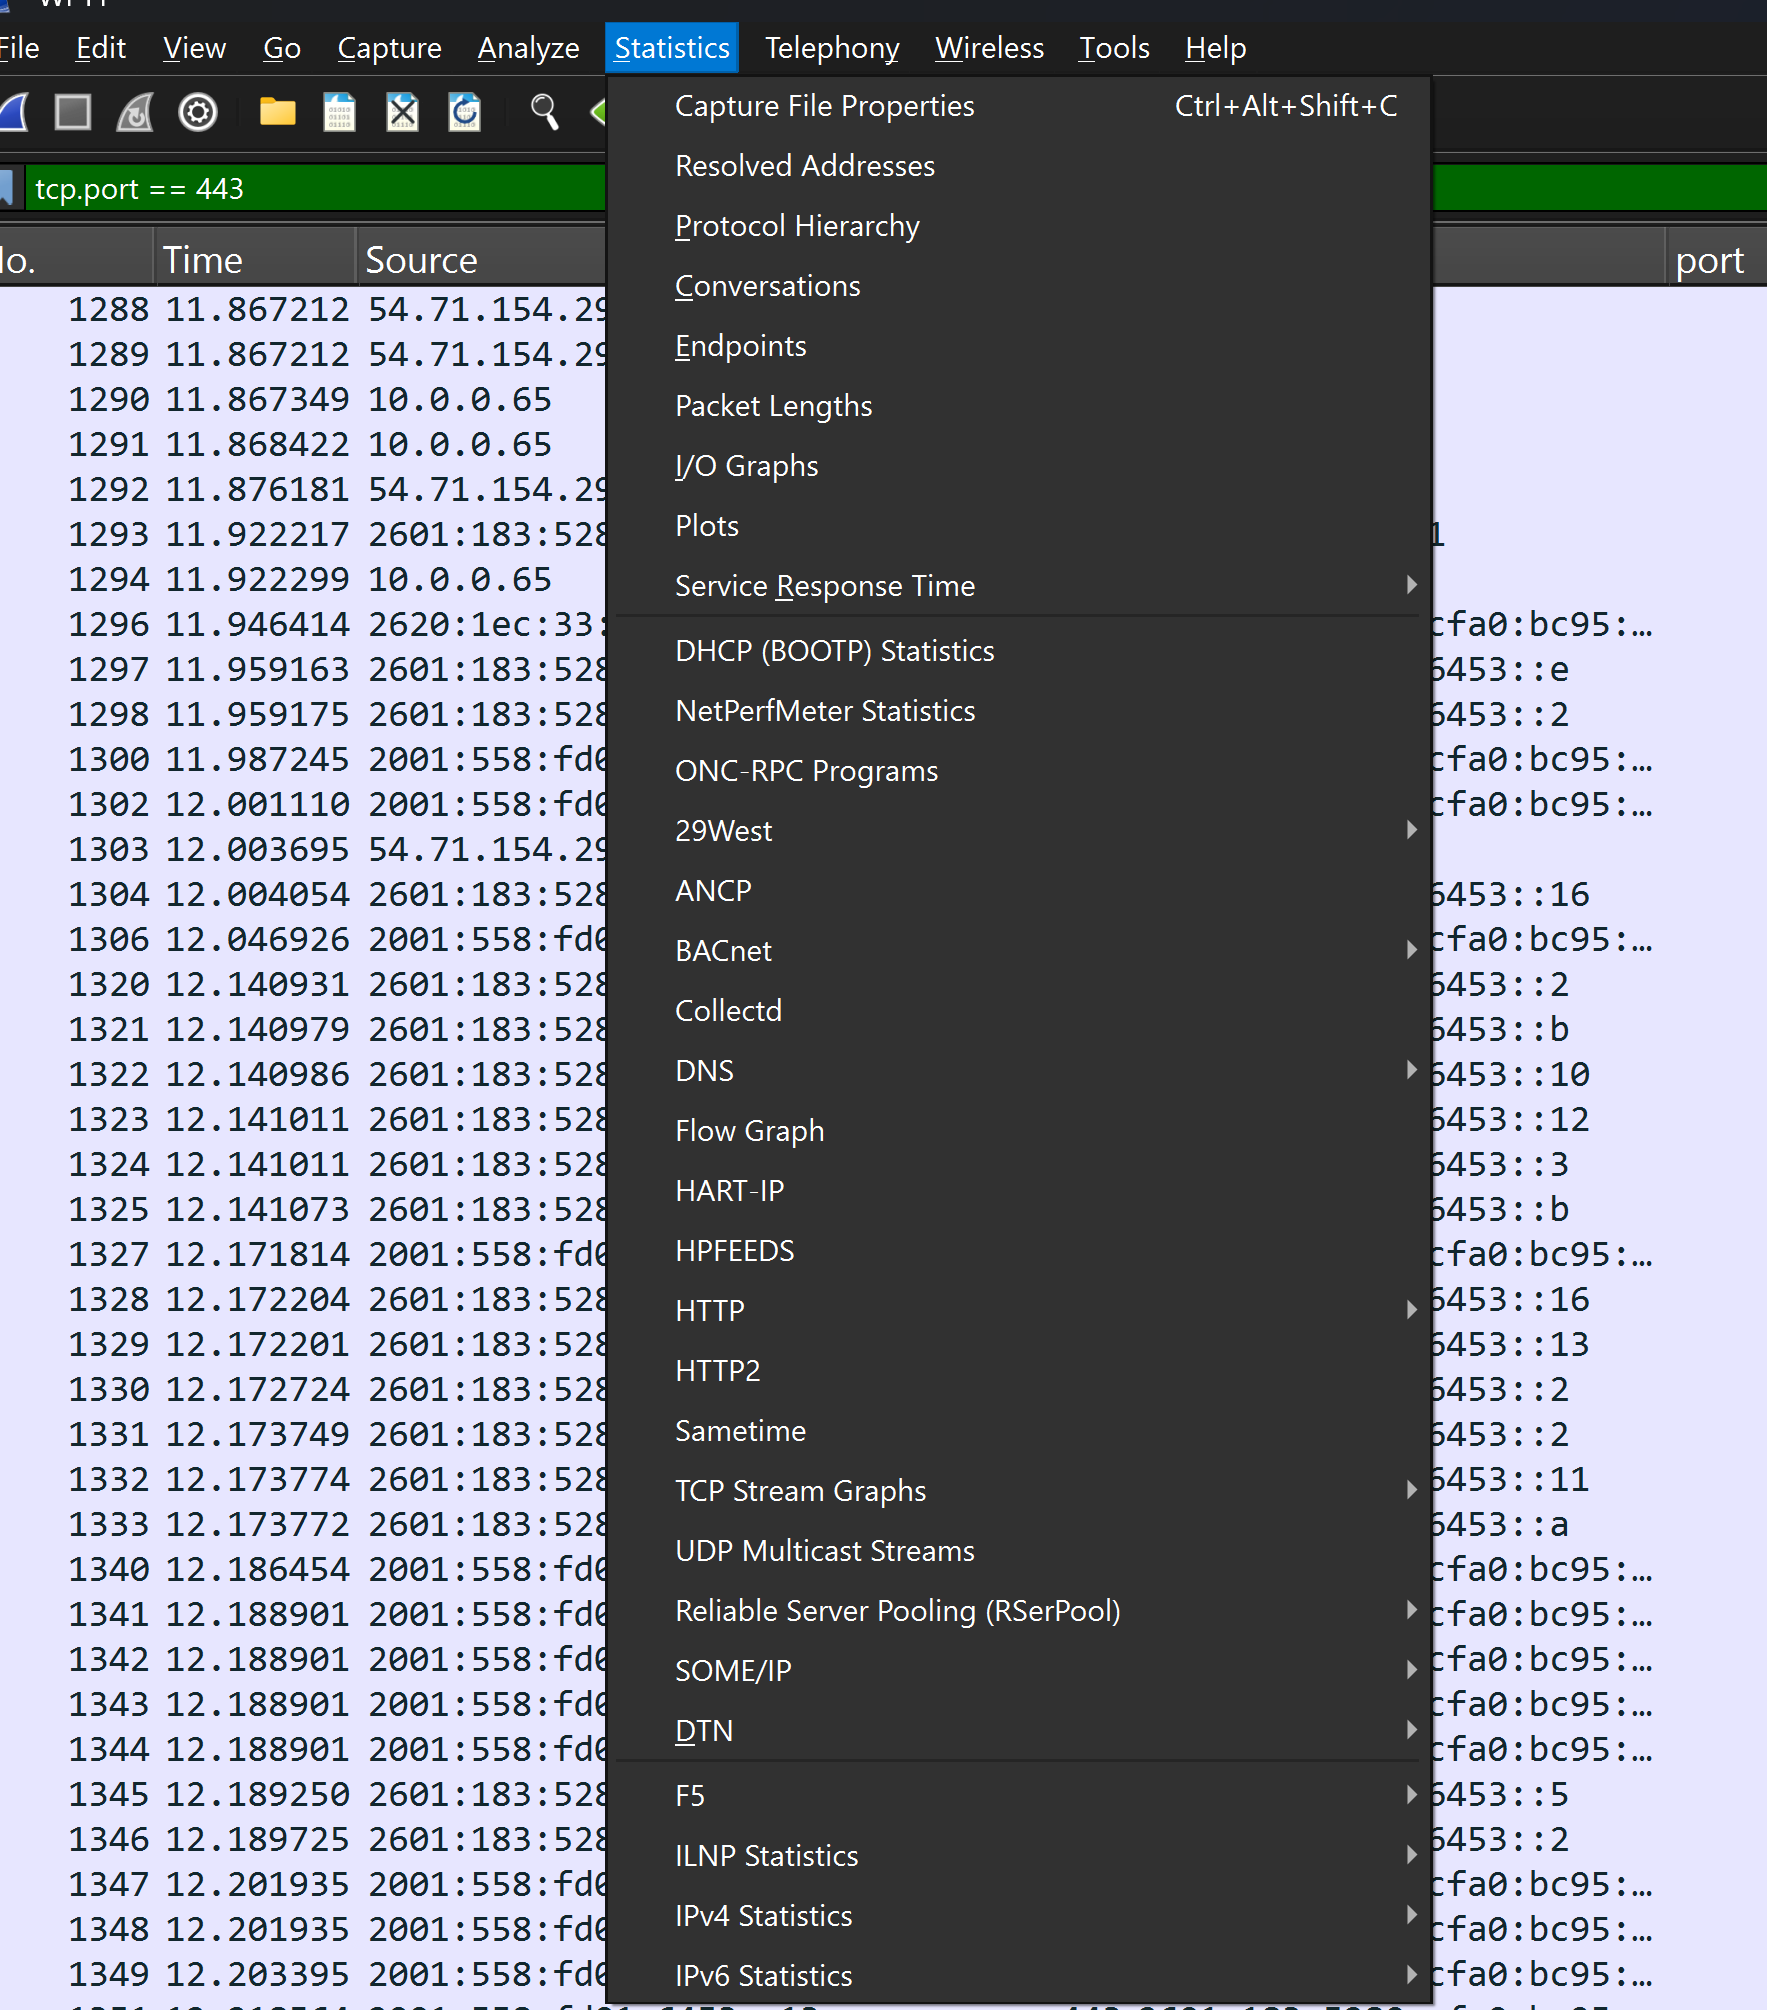
- Analyze Tab: This focus is on deep-dive tools. It allows analysts to examine Expert Info (automated alerts on traffic anomalies), manage complex filters, and use the “Follow Stream” functionality.
Reconstructing conversations with TCP streams. Data is often fragmented across hundreds of packets, making it difficult to read in the main window. Wireshark can “stitch” these packets back together to recreate the original interaction.
- Execution: By right-clicking a packet and selecting Follow -> TCP, you open a window that displays the entire conversation in chronological order.
- Impact: This process filters out all unrelated background noise, allowing you to track a full data transfer or login sequence from start to finish. You can also use the display filter
tcp.stream eq #to track these specific conversations.
Data and file extraction. If a full conversation is captured without missing segments, Wireshark can recover the actual files sent over the wire.
- Automated Export: For common protocols like HTTP, SMB, and DICOM, you can use the File -> Export Objects menu to save files directly from the capture.
- Manual FTP Reconstruction: Because FTP uses separate channels for commands (Port 21) and data (Port 20), extraction requires a specific manual workflow:
- Identify Activity: Use the
ftpfilter to find FTP hosts. - Inspect Commands: Use
ftp.request.commandto see usernames, passwords, and the names of files being requested. - Isolate Data: Filter for
ftp-datato find the actual file content transfer. - Reconstruct: Follow the TCP stream for the data packet, change the view to “Raw,” and save the output with its original file extension.
- Identify Activity: Use the
By following these advanced workflows, an analyst can validate not just that a connection occurred, but exactly what data - such as documents, images, or credentials - was exchanged or potentially exfiltrated.
Packet Inception: Dissecting Network Traffic
Next lab was Packet Inception. The goal was to pull objects out of previously captured network traffic. We were provided a packet capture from an unencrypted web session with an image embedded that the Security manager suspected was being used to smuggle hidden messages. The job was to apply filters to locate and extract the evidence.
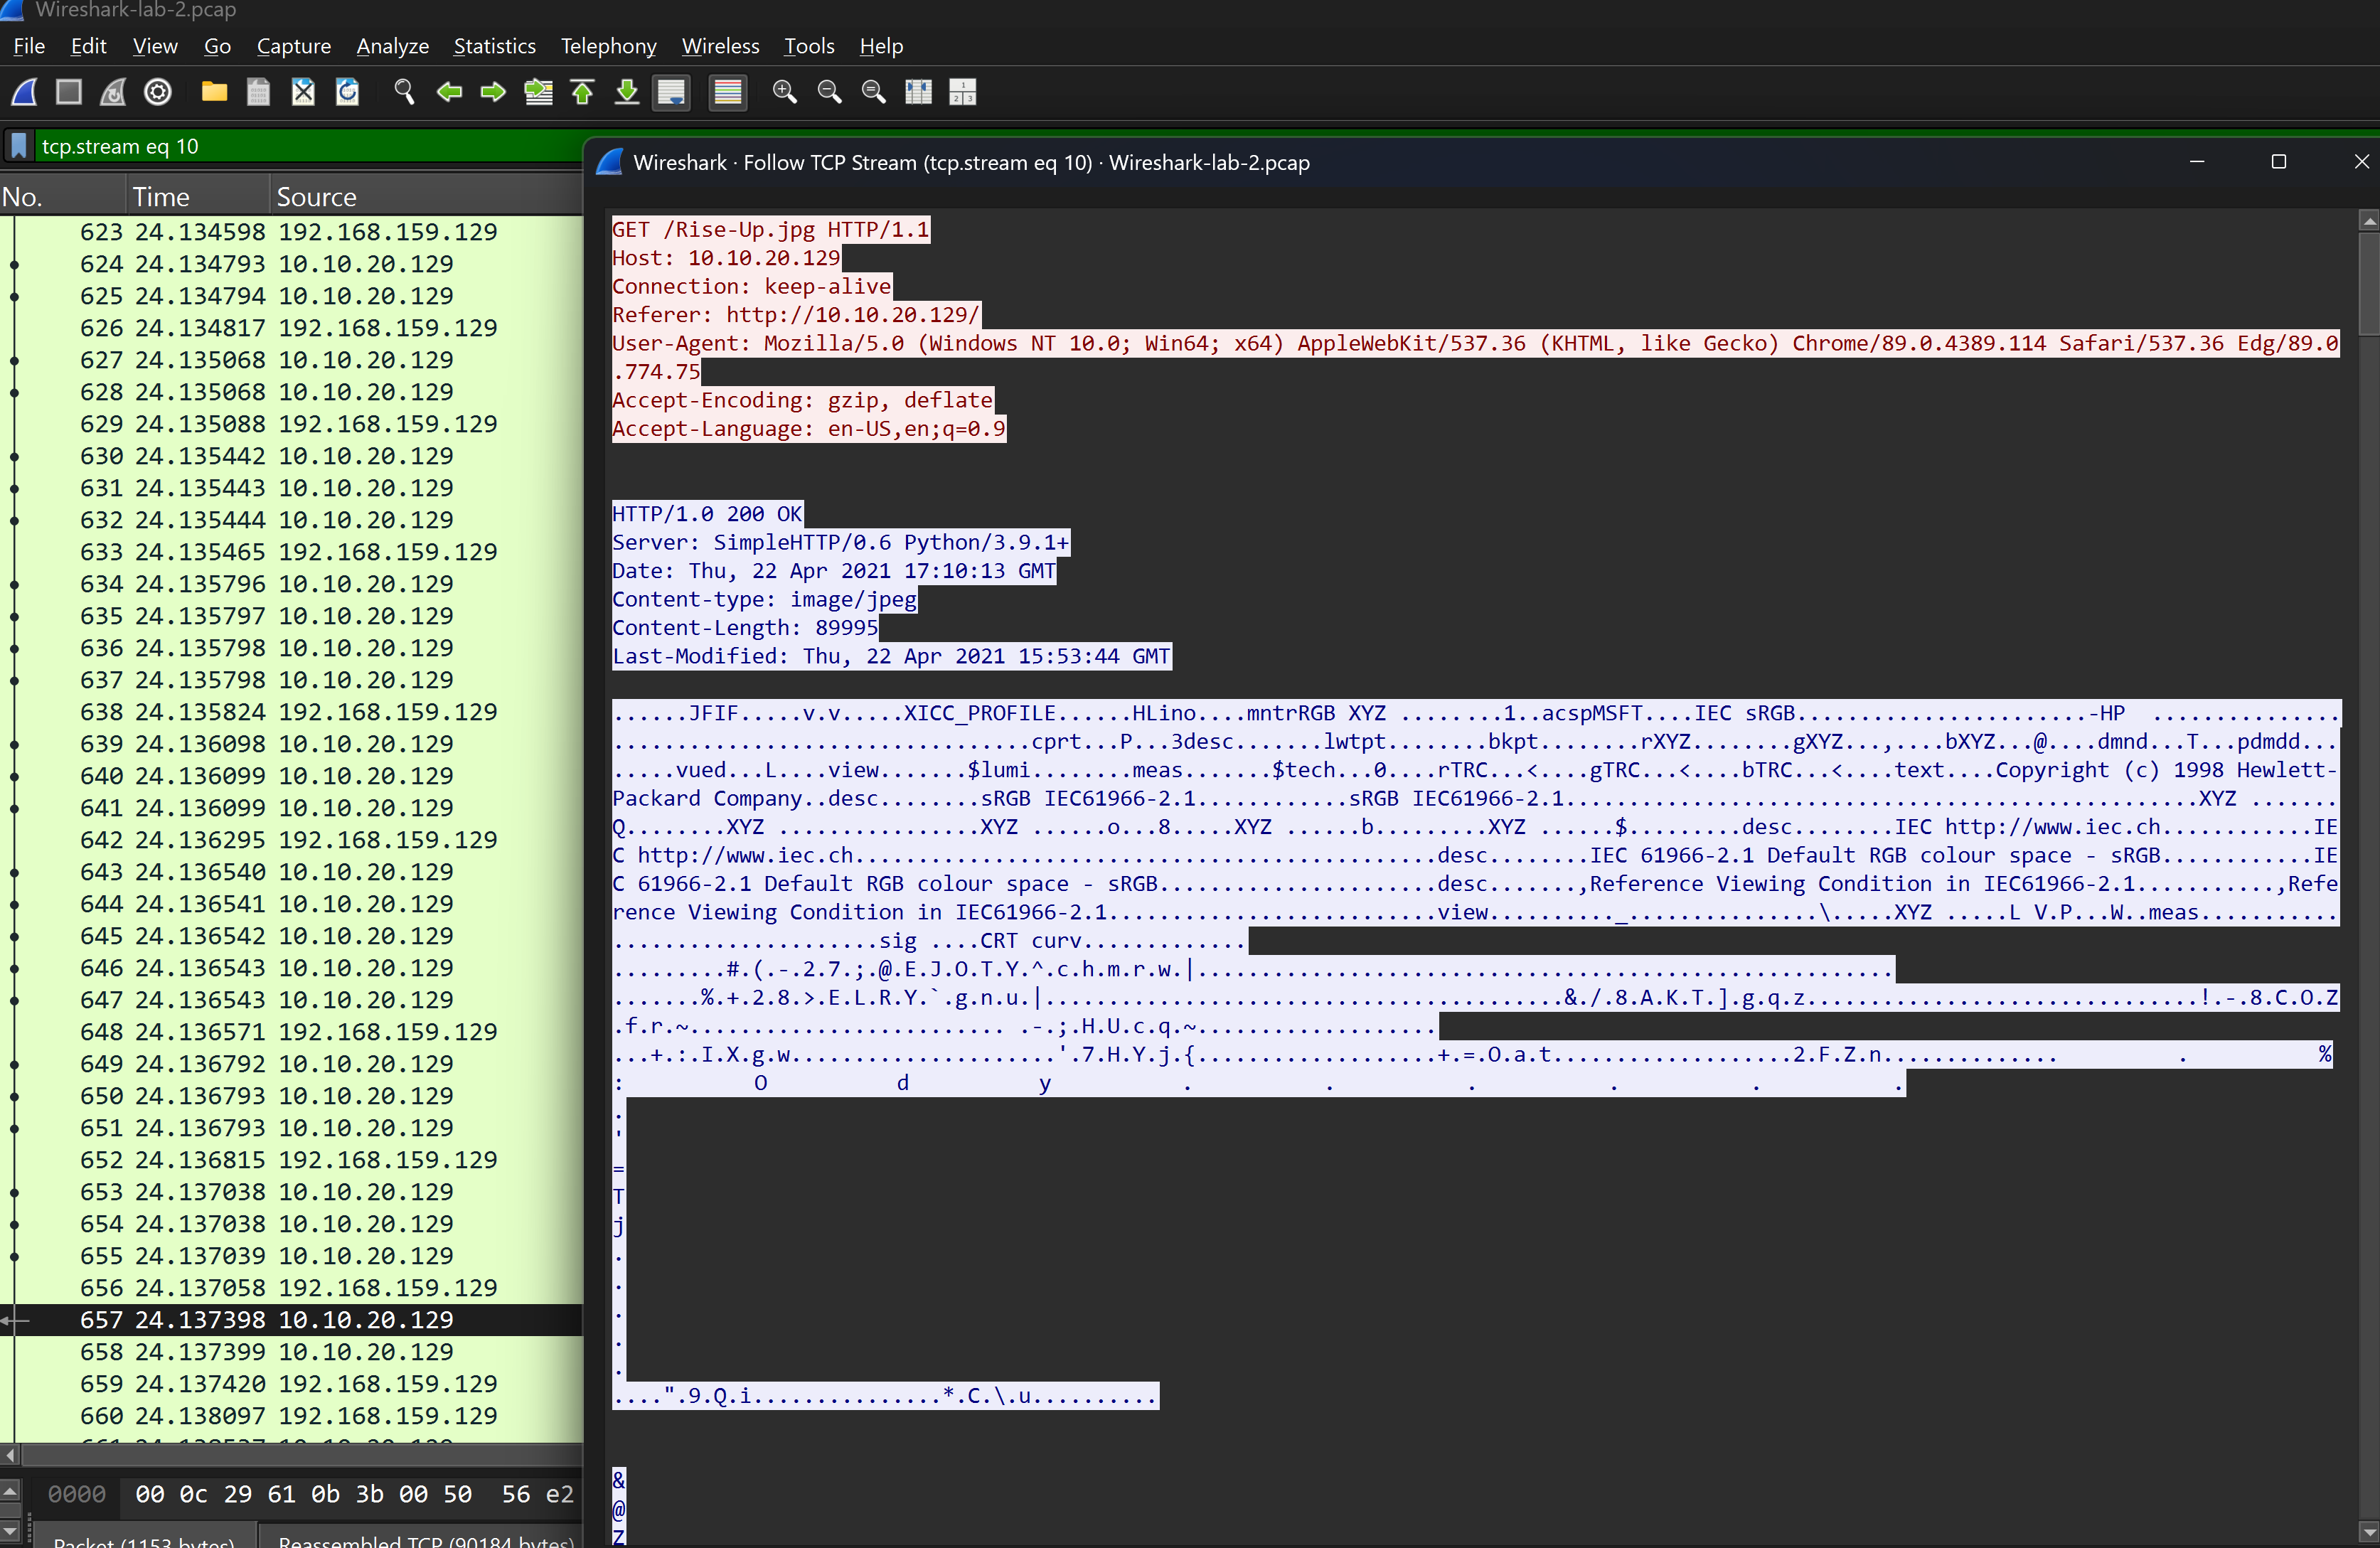
Basic filter for HTTP traffic:
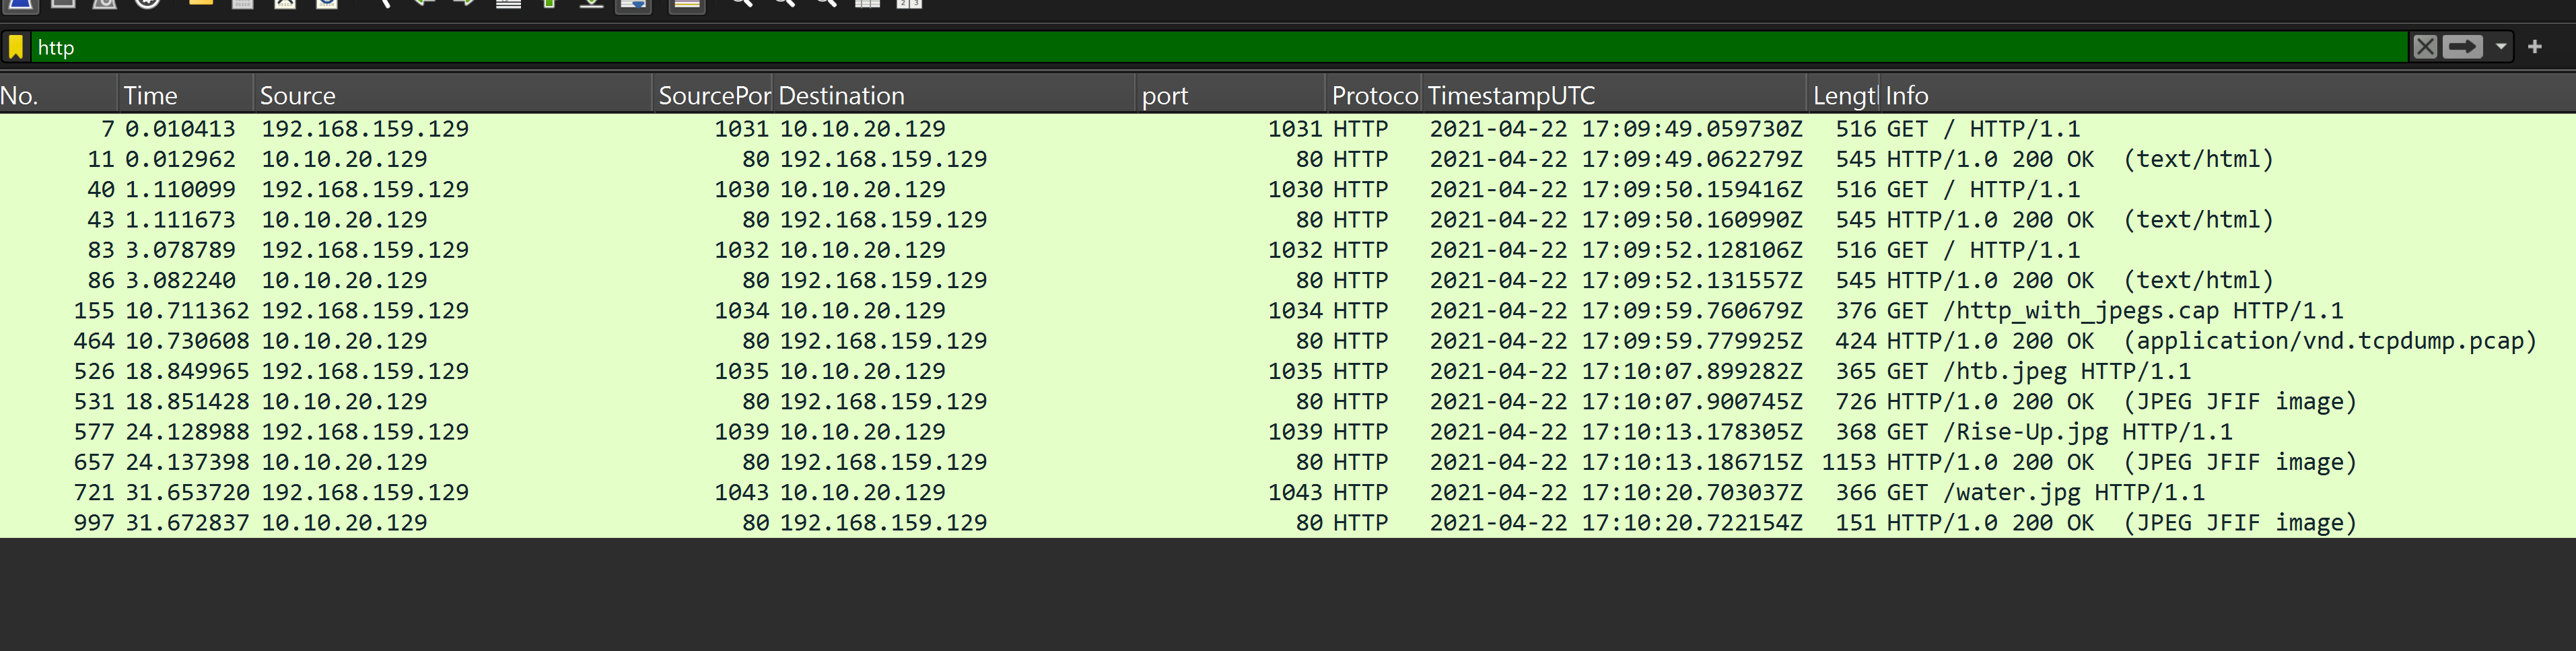
To prove a transfer happened, you just need:
- 200 OK in the Info column (request succeeded).
- Follow -> TCP Stream - shows the request, response, and file. For a JPEG you’ll see
GET /Rise-Up.jpg,200 OK,Content-Type: image/jpeg, and the body starting with the JFIF marker.
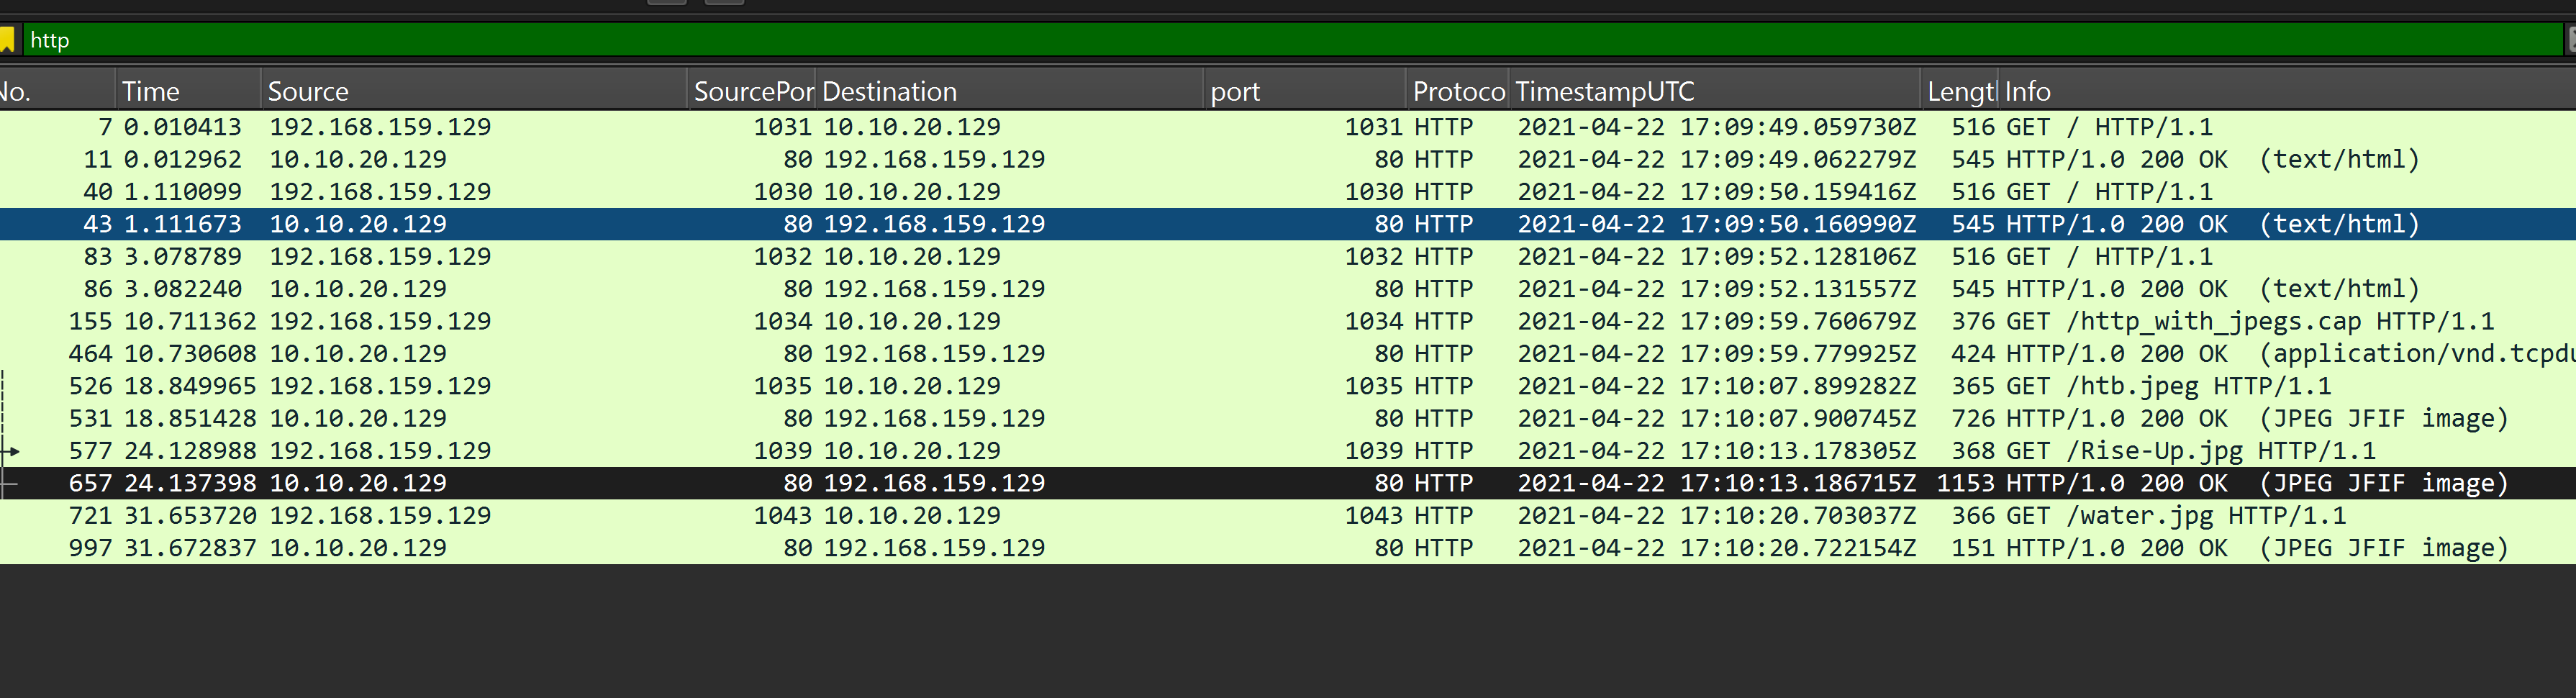
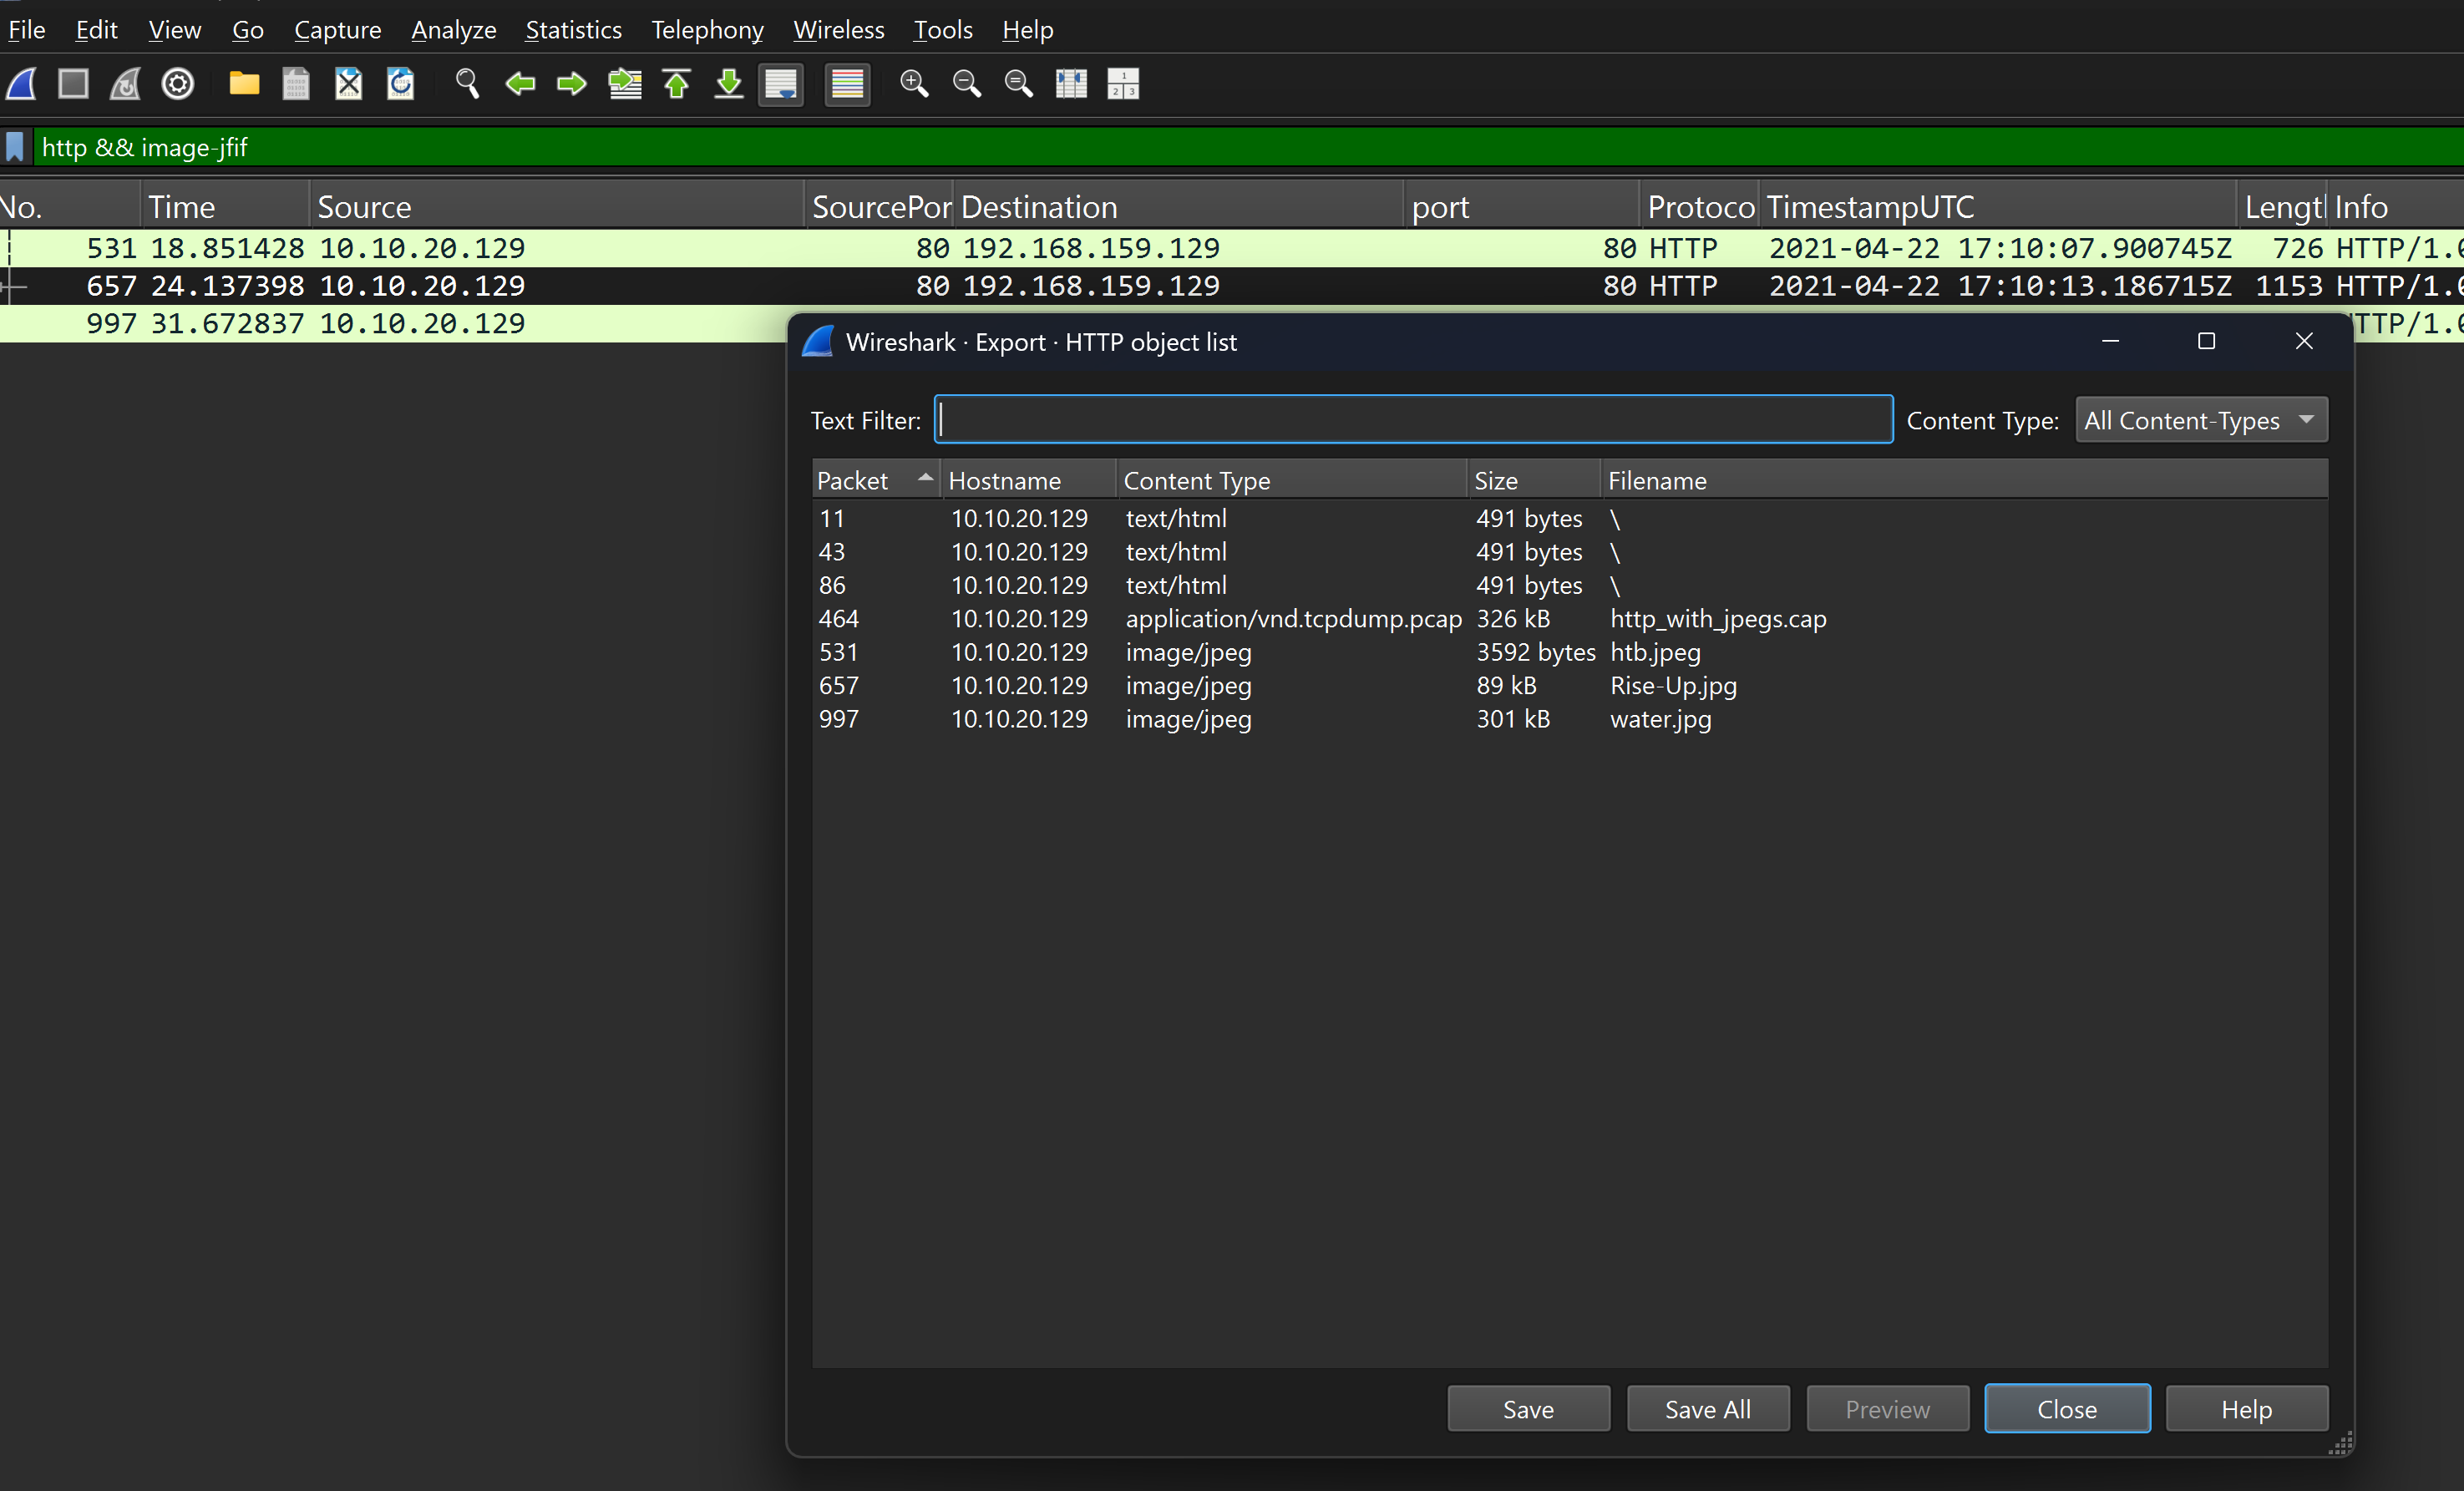
Faster way - filter the whole capture:
http && image-jfif
This shows only HTTP responses carrying JPEGs (3 here), each marked 200 OK (JPEG JFIF image).

After this you can just dump the object with File -> Export Objects -> HTTP -> file.JPG.
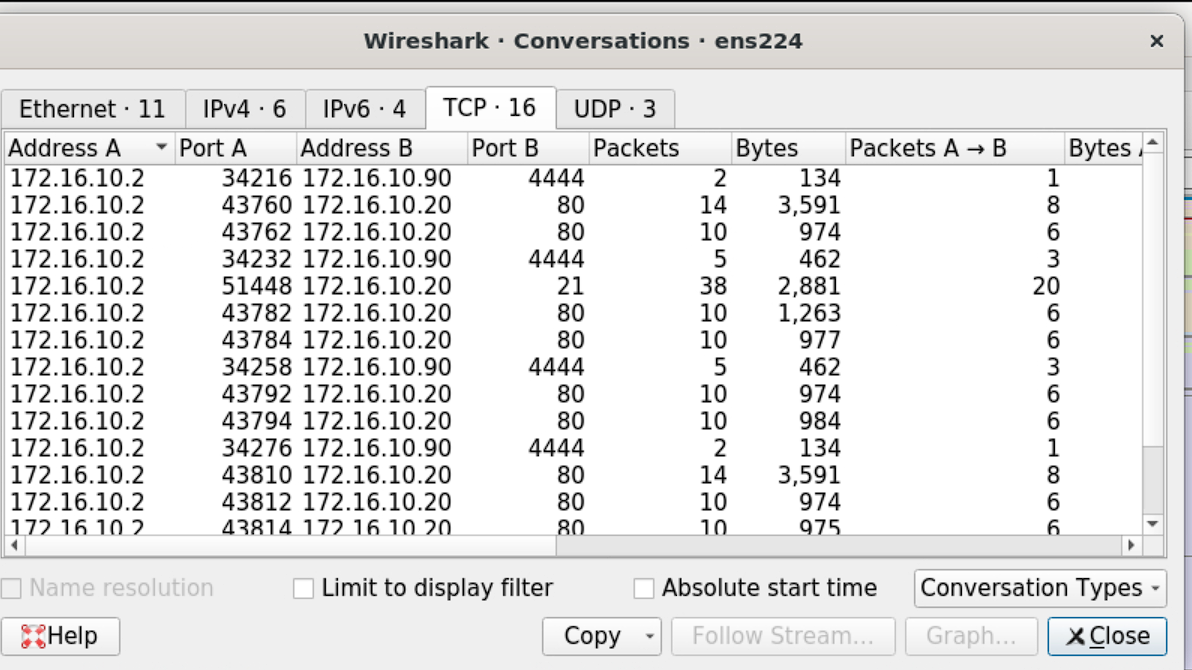
Self analysis. For the live-capture portion of this lab we were concerned with the hosts 172.16.10.2 and 172.16.10.20.
How many conversations can be seen? Statistics -> Conversations, then the TCP tab. Each row is one conversation - 16 distinct TCP conversations.
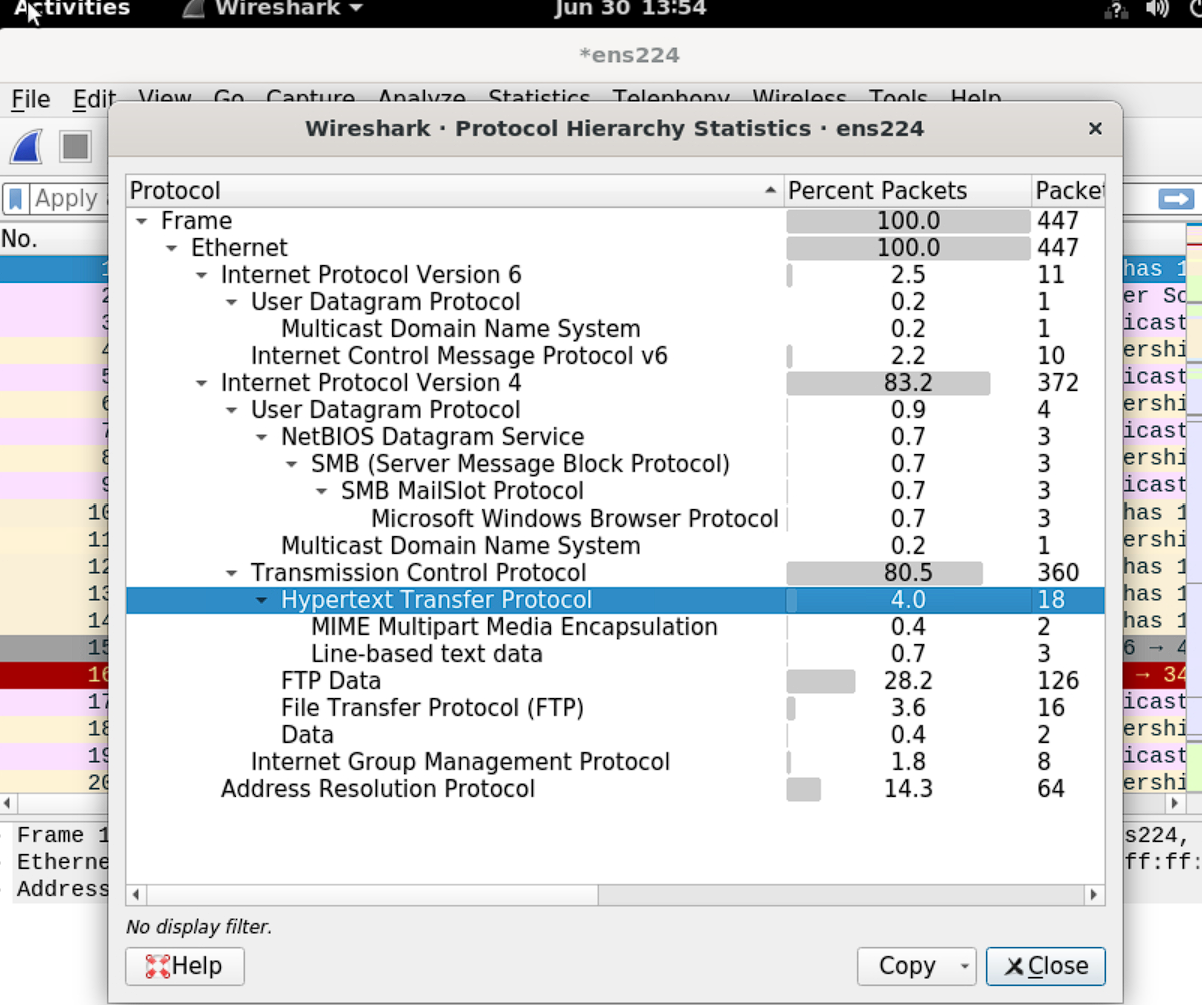
What protocols are being utilized? Protocol Hierarchy answers “what protocols.” Reading it: TCP dominates (80.5%), carrying HTTP (web), FTP + FTP Data (file transfer, 28.2% is the actual file bytes). Some UDP/NetBIOS/SMB, ICMPv6, IGMP, and ARP - those are normal background/local network chatter. So the headline protocols are HTTP and FTP, matching the lab.
From the Conversations table: because 172.16.10.2 always uses high, random source ports while the other hosts sit on fixed well-known ports, 172.16.10.2 is the client and 172.16.10.20 is the server (port 80 HTTP, port 21 FTP). The 172.16.10.90 host on port 4444 stands out as suspicious.
From the Protocol Hierarchy: the capture is mostly TCP, carrying HTTP (web traffic) and FTP / FTP-Data (file transfer). Both are cleartext protocols, so they’re potential sources of readable data - including FTP credentials (USER/PASS) and transferred files.
So combining the two: Conversations tells us who is talking and their roles (client vs server), and Protocol Hierarchy tells us what they’re using (HTTP + FTP).
FTP analysis confirms the same - the FTP commands are in cleartext: client 172.16.10.2 logs in as USER anonymous, then retrieves a file with RETR flag.jpeg (a JPEG pulled over FTP, ready to carve out the same way as the HTTP JPEGs), so you can now extract the image of your choice.
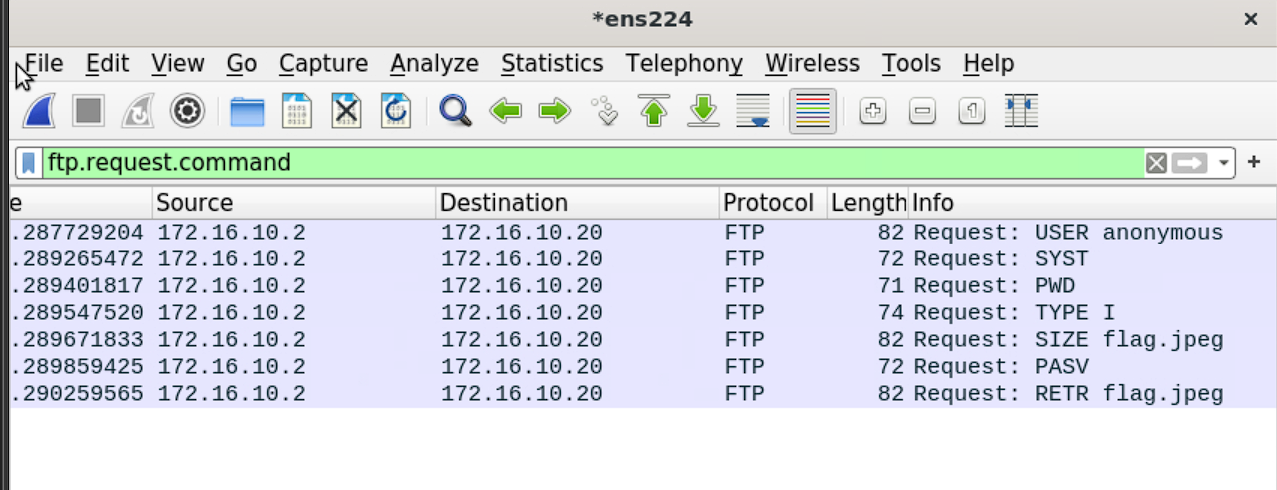
Just follow the TCP stream as needed - you can dump from File -> Export Objects, but going as the lab mentions:
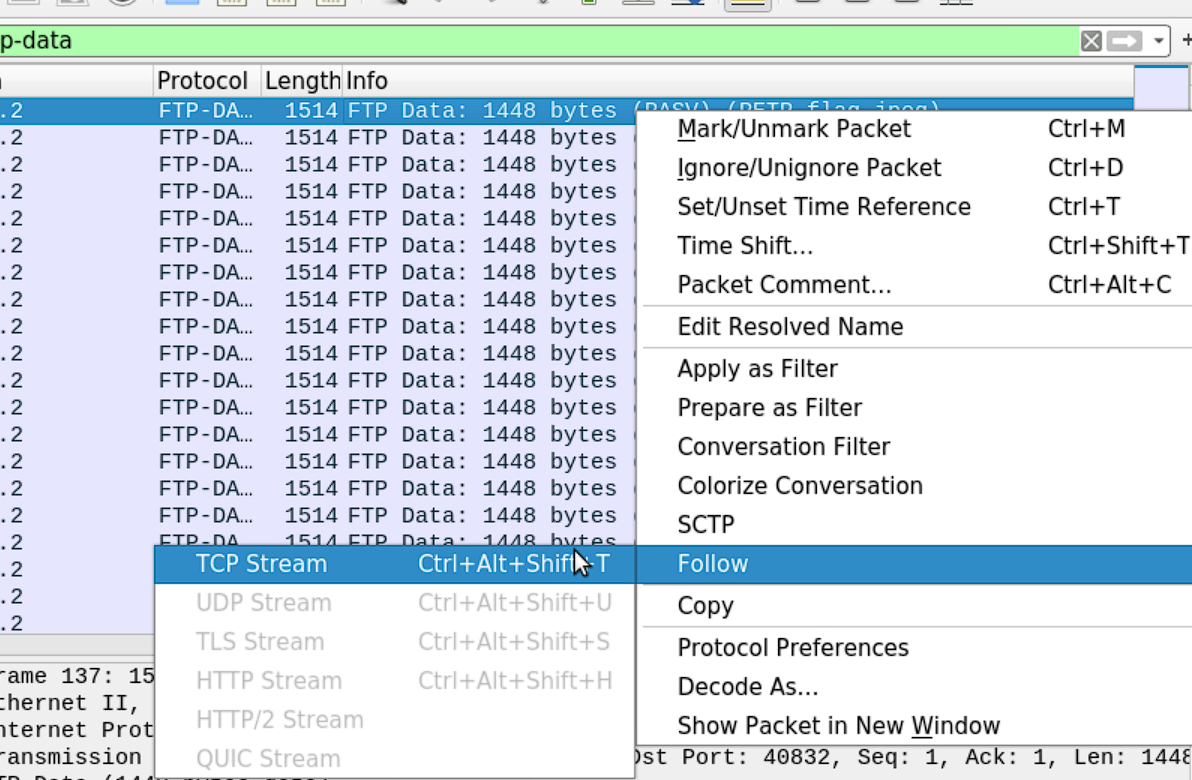
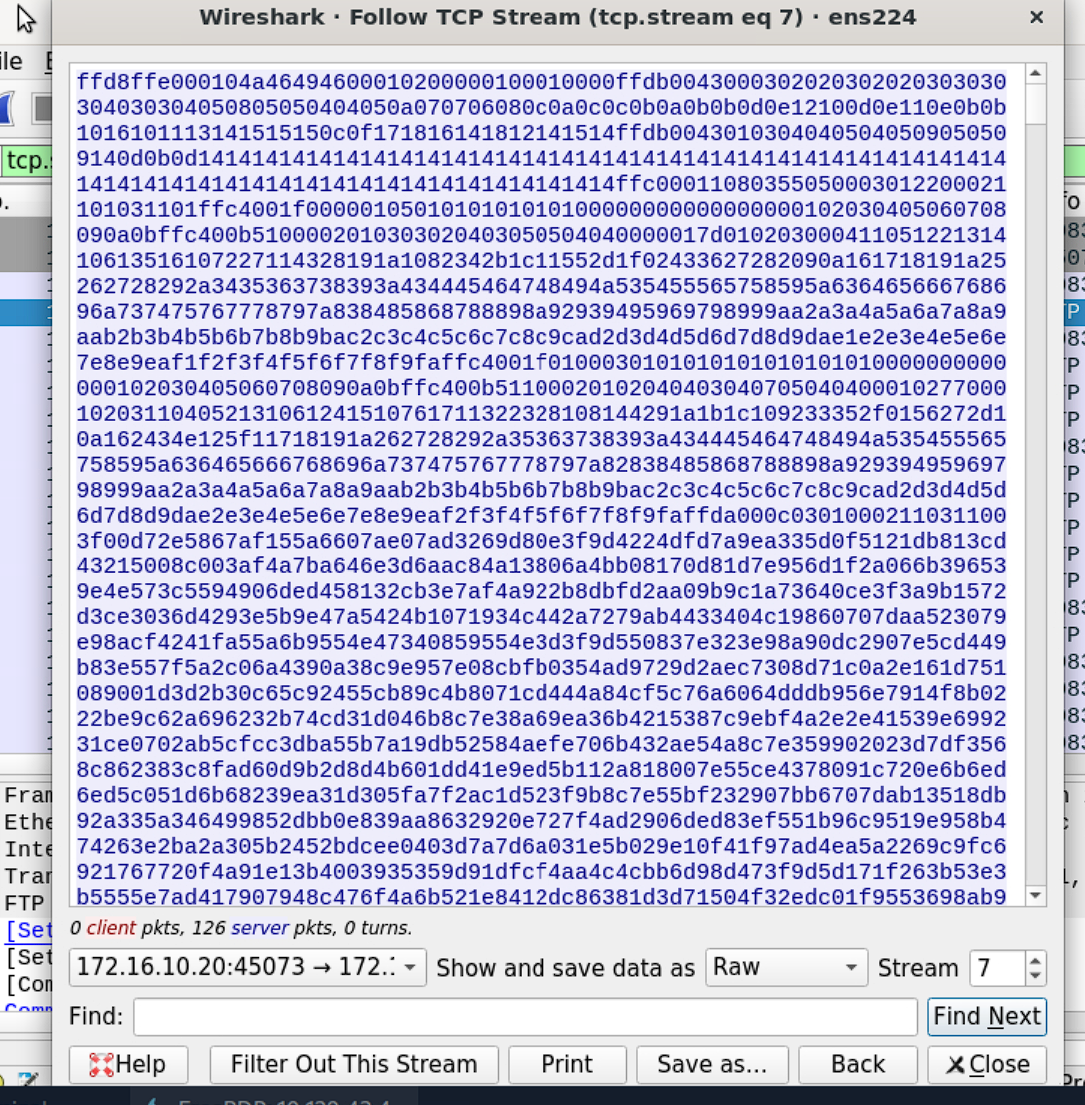
Then click “Save as” and you will see the extracted image.
After this, on HTTP with just the http.request filter: the webserver is 172.16.10.20, responding on port 80. The requested pages are all .php (login.php, admin.php, index.php, register.php, forgot_password.php, logout.php), indicating a PHP web application. The exact server software can be confirmed from the Server header in any HTTP response. The most common request method was GET, used to retrieve the various pages, with a smaller number of POST requests to /login.php for credential submission.
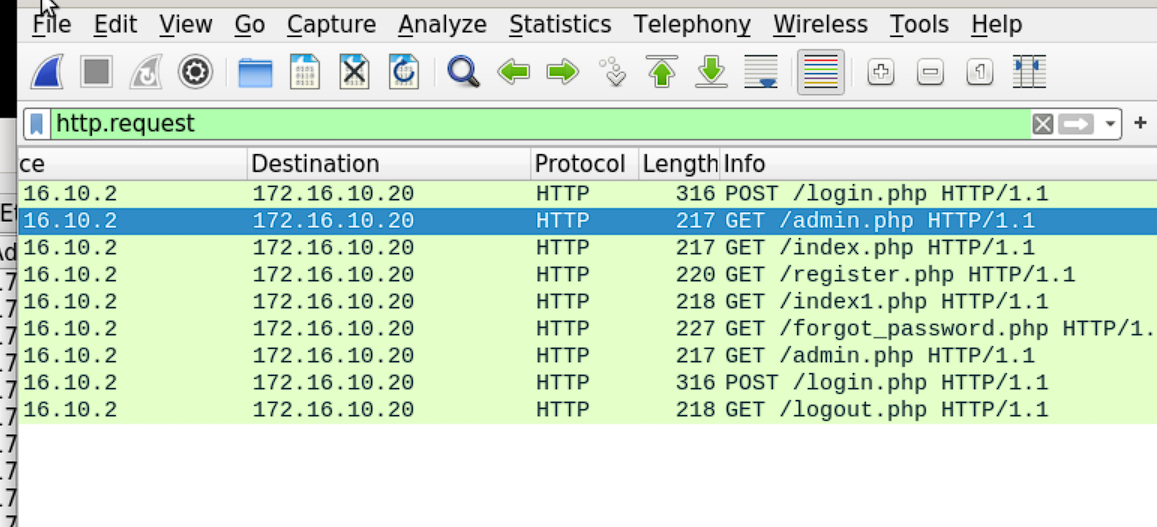
Now, following the HTTP stream, you can get additional details.
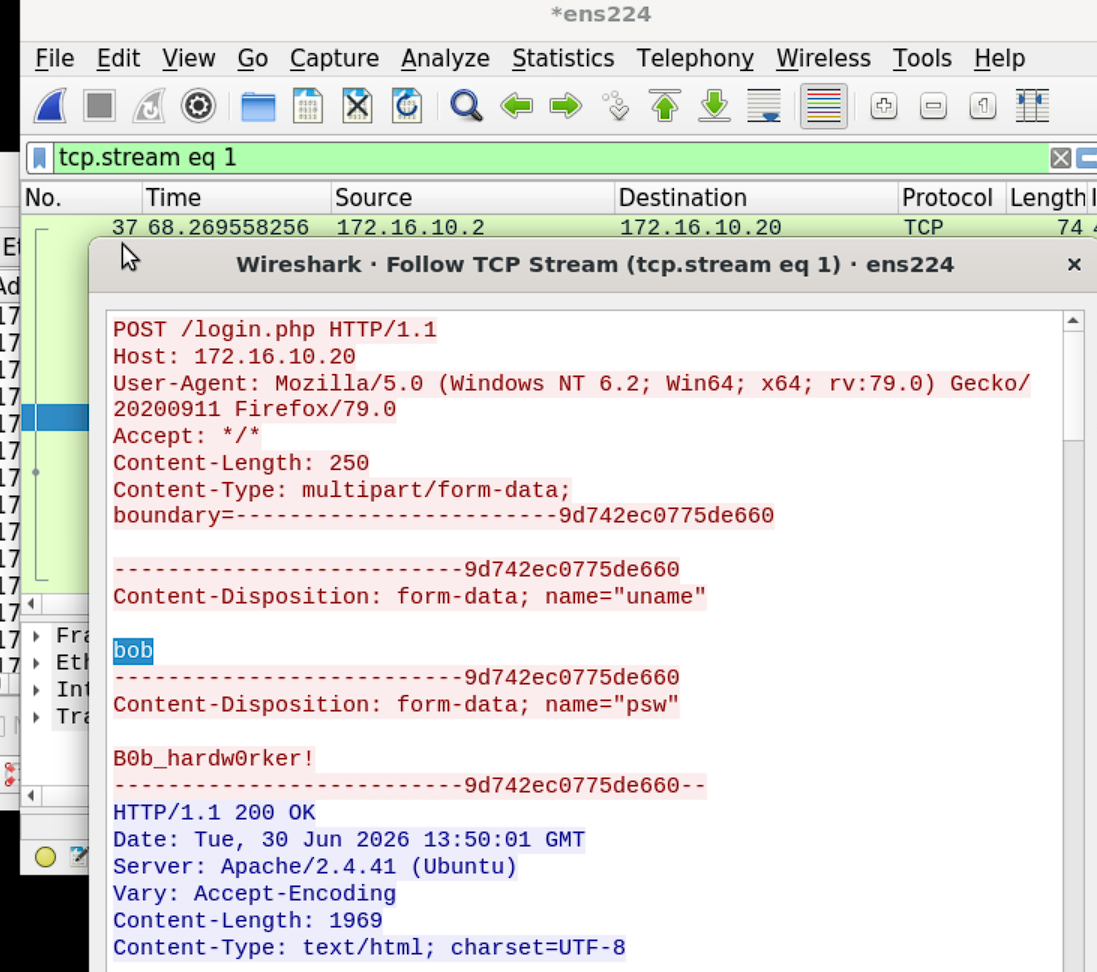
Guided Lab: Traffic Analysis Workflow
After the carving labs, the module moved into a guided investigation, running the full analysis workflow on a live case.
One of our fellow admins noticed a weird connection when analyzing the baseline captures. The task was to work it using the analysis process. Here’s a clean table for my notes:
| Field | Detail |
|---|---|
| Issue | Suspicious traffic originating from within the network |
| Scope and goal | Identify traffic from 10.129.43.4 and determine if activity is ongoing |
| Timeframe | Last 48 hours |
| Supporting file | NTA-guided.pcap |
| Target(s) | Host 10.129.43.4 and any host connected to it |
| Protocol of interest | Unknown protocol over port 4444 |
| Capture method | Live capture on the 10.129.43.0/24 network + provided historical PCAP |
| First filter | Isolate anything with a connection to 10.129.43.4 |
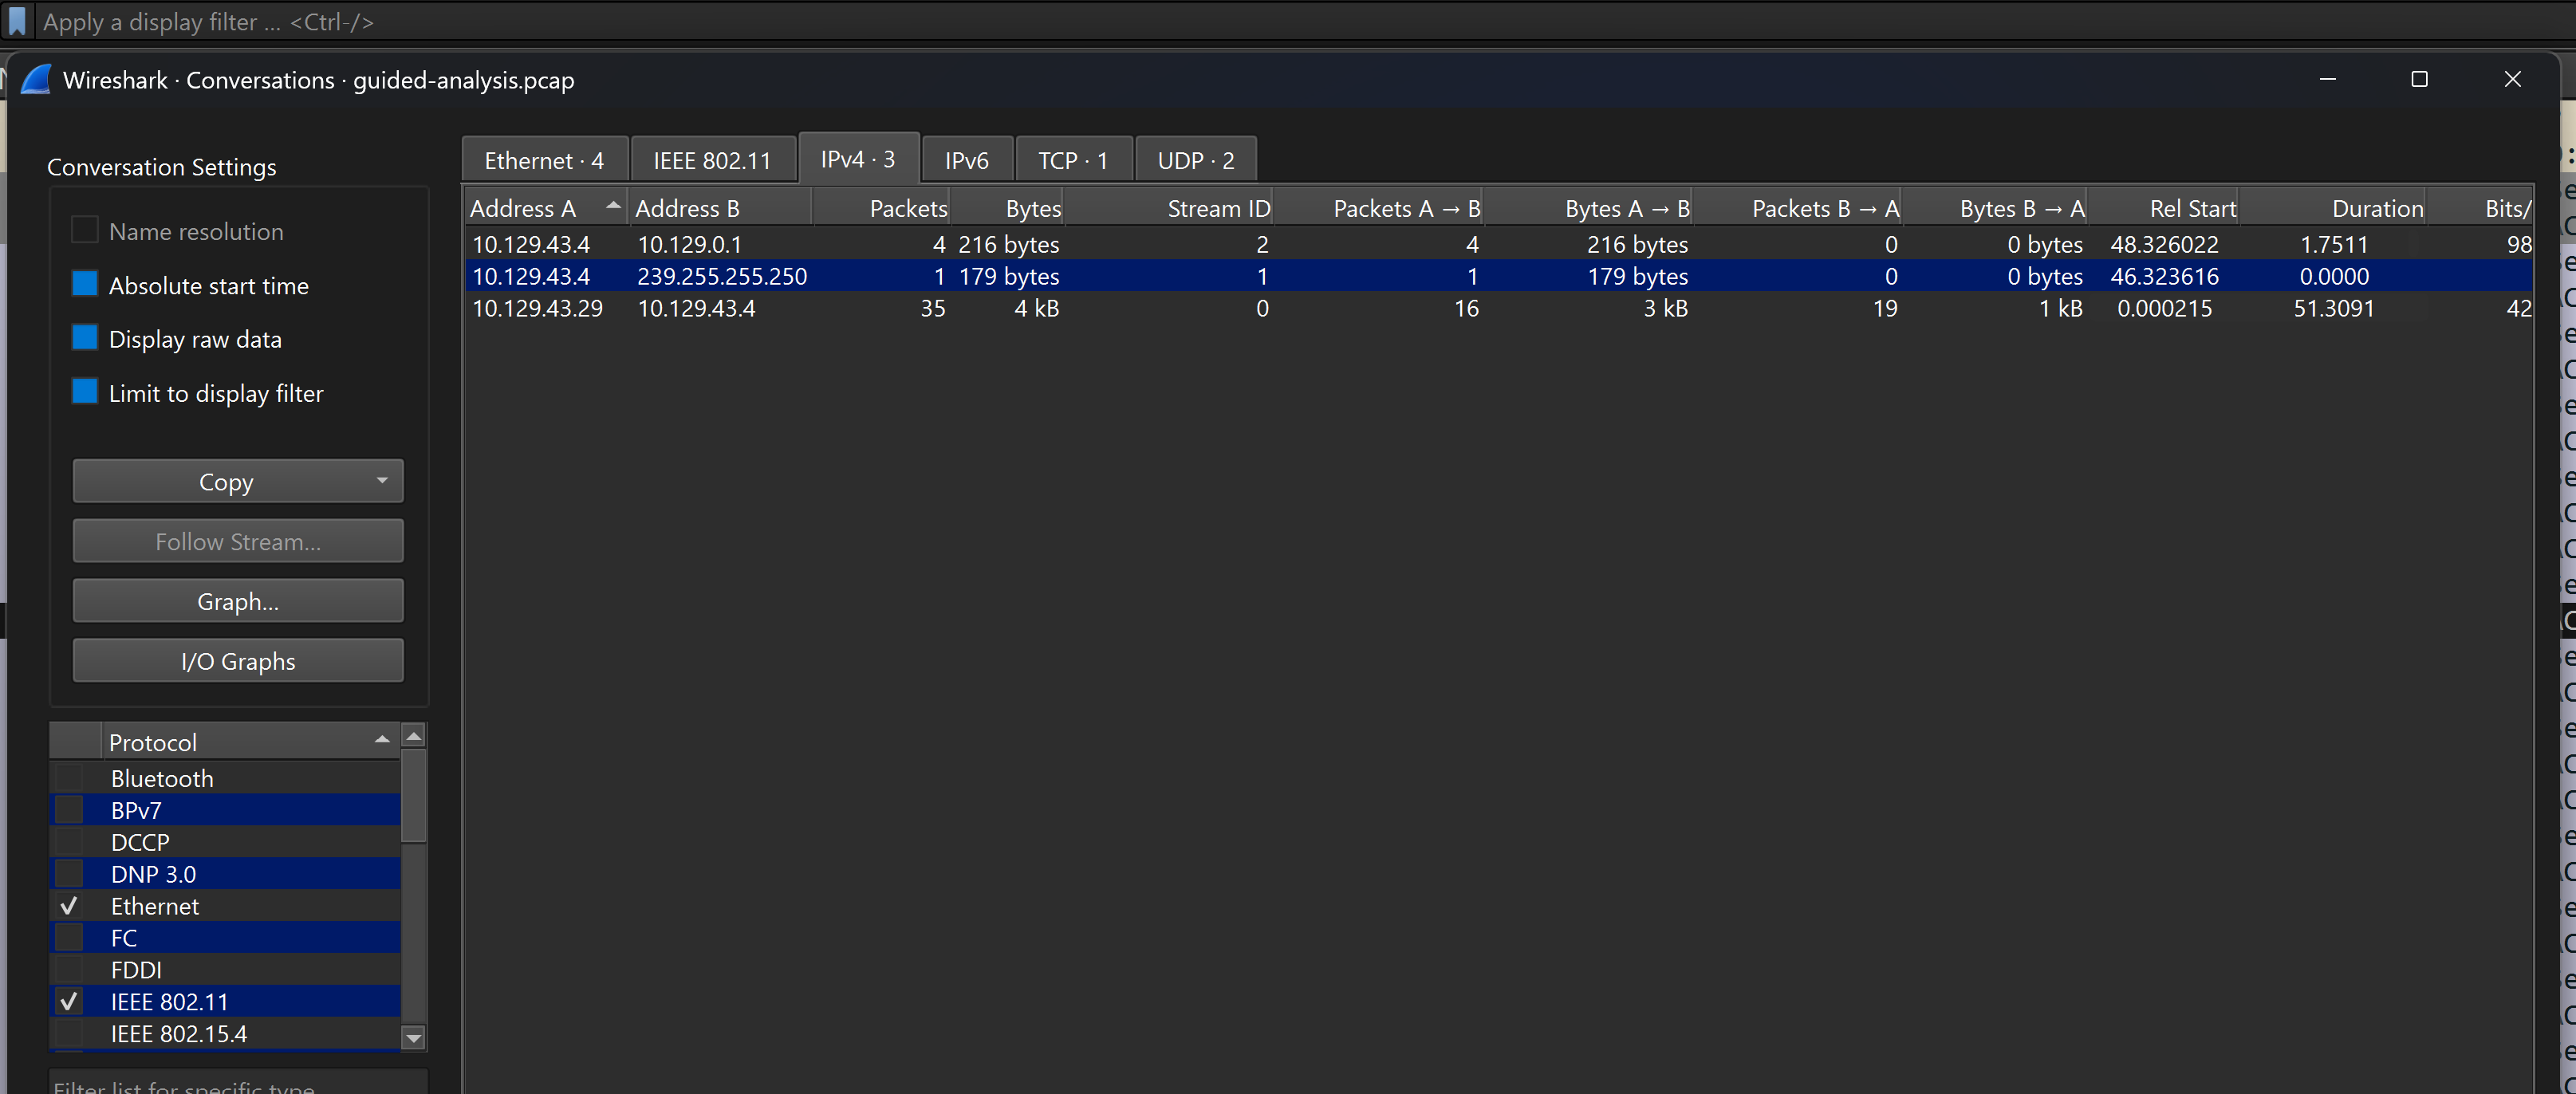
From Conversations, the key finding to note alongside this: 10.129.43.4 is in a sustained two-way exchange with 10.129.43.29 (~51s, bidirectional) - that’s the connection matching the port 4444 scope and the one to investigate next.
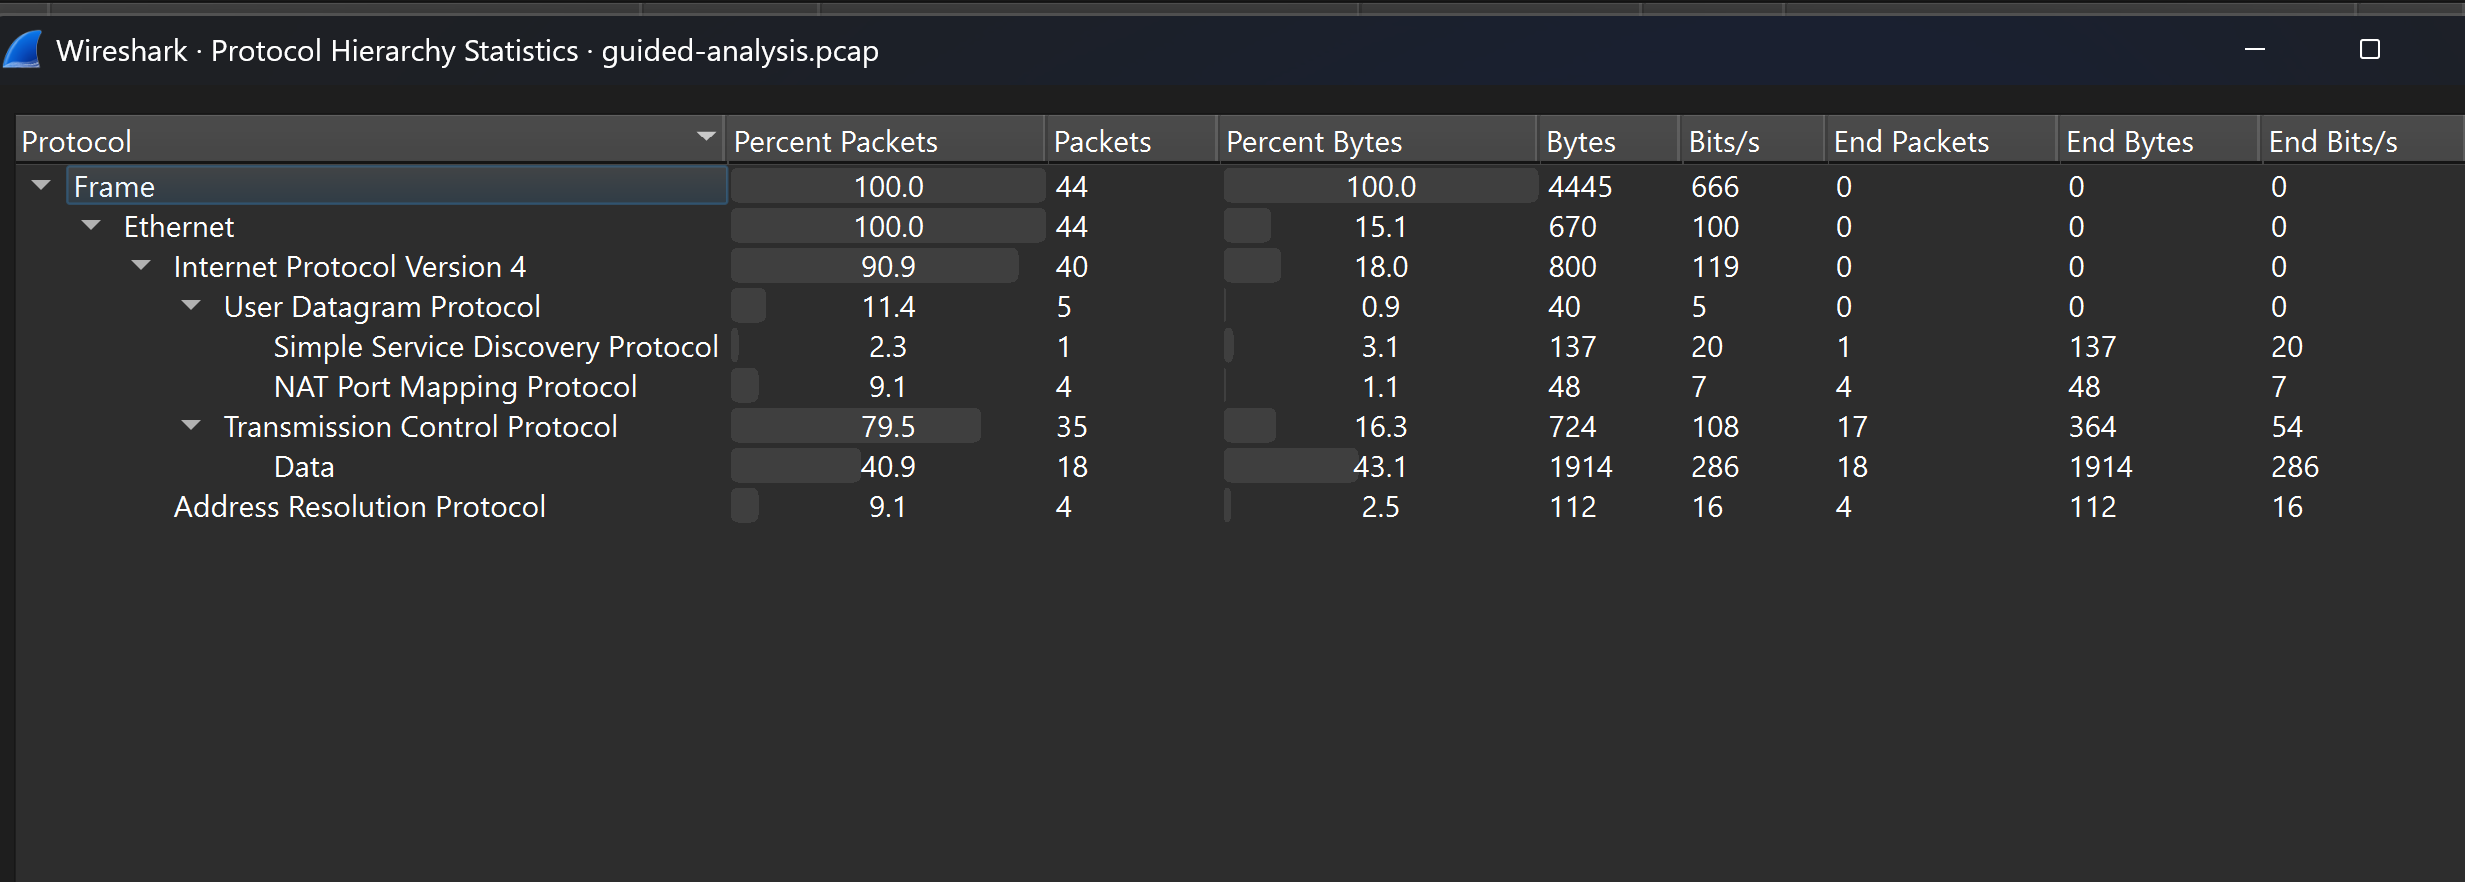
Protocol Hierarchy shows TCP traffic and some UDP traffic.
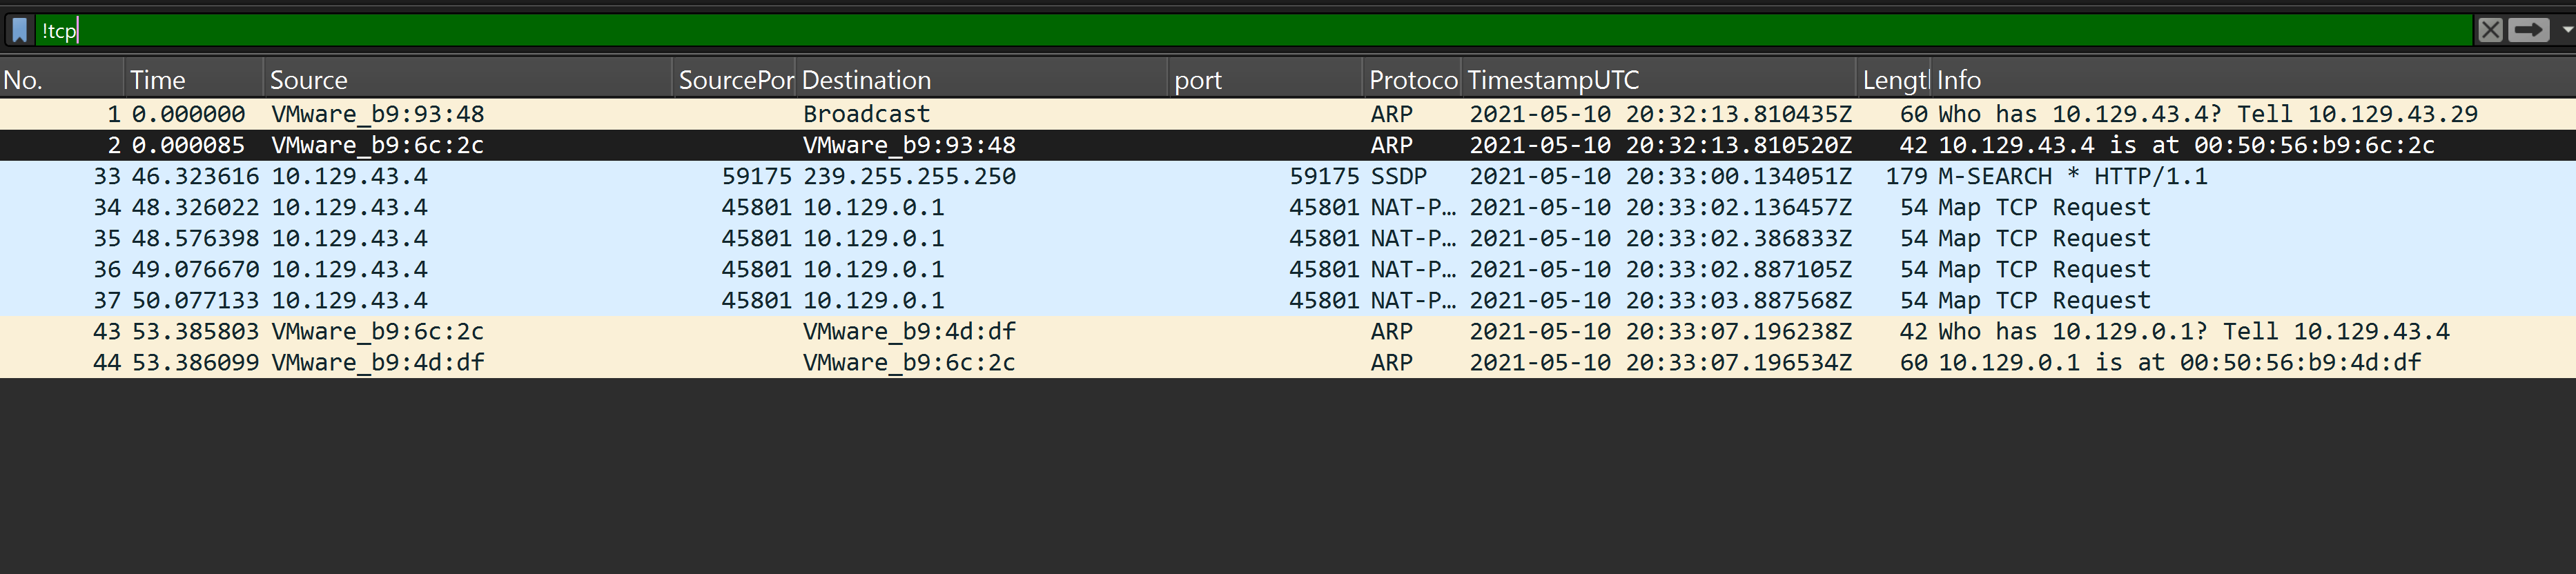
Before checking the TCP: four ARP packets, four Network Address Translation (NAT), and one Simple Service Discovery Protocol (SSDP) packet. Based on their packet types and the information they contain, we can determine that this traffic is normal network traffic and nothing to be concerned about.
Now what’s left is the TCP traffic. Making a filter based on what we found on the Statistics tab, we get that the connection is still active with no reset, so now let’s follow the TCP stream.
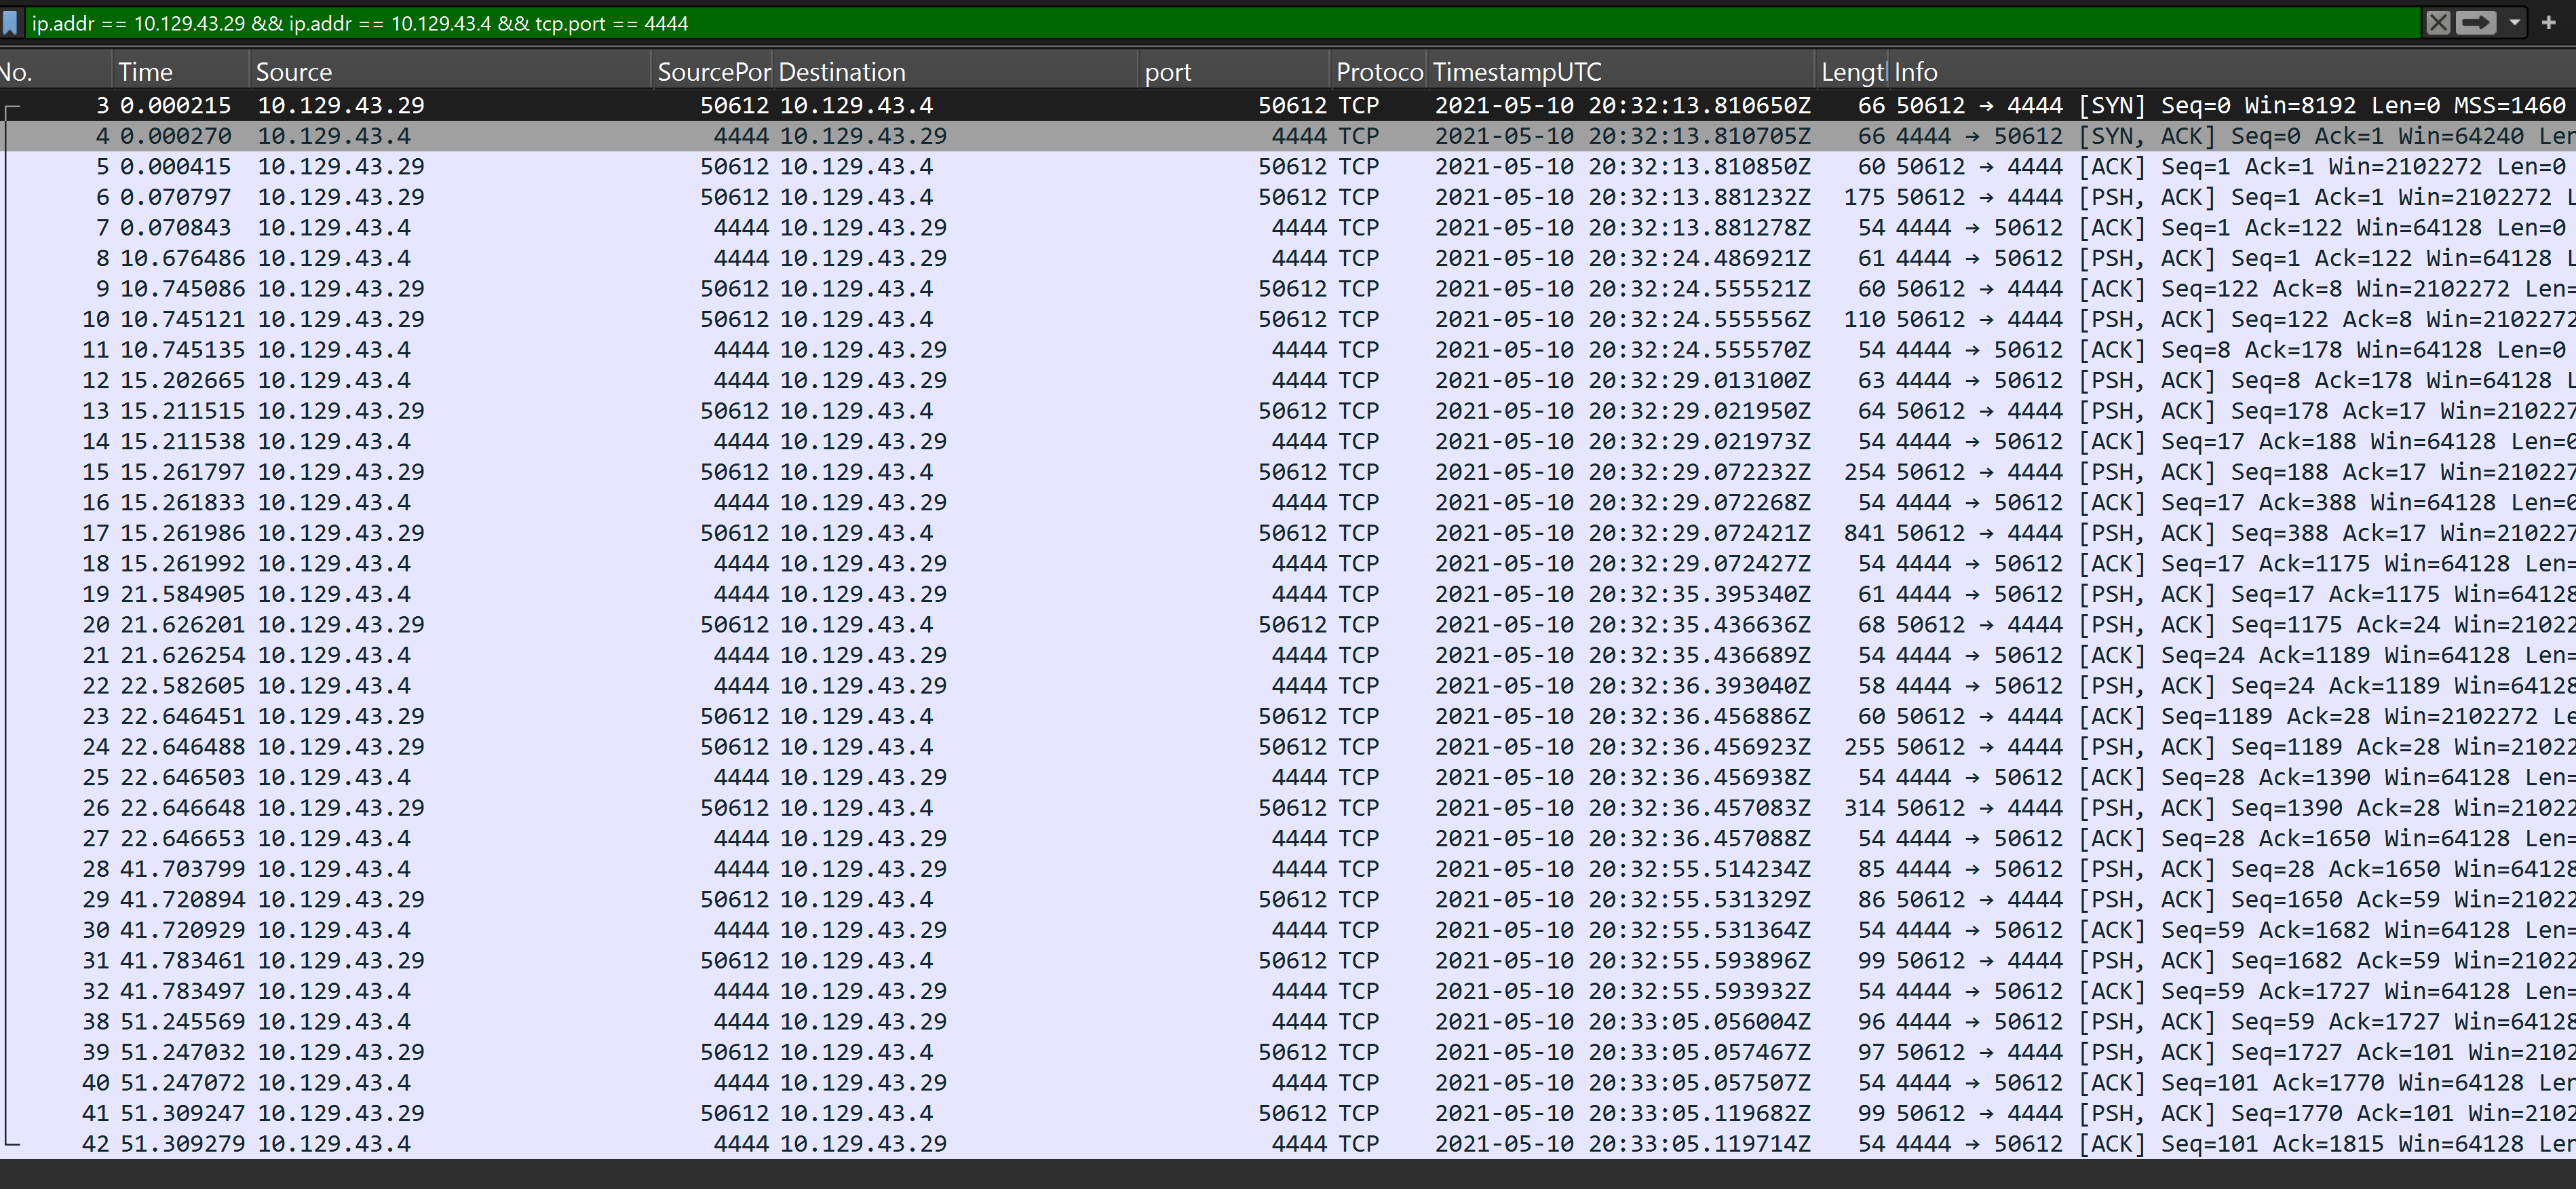
Following the TCP stream gives us something important.
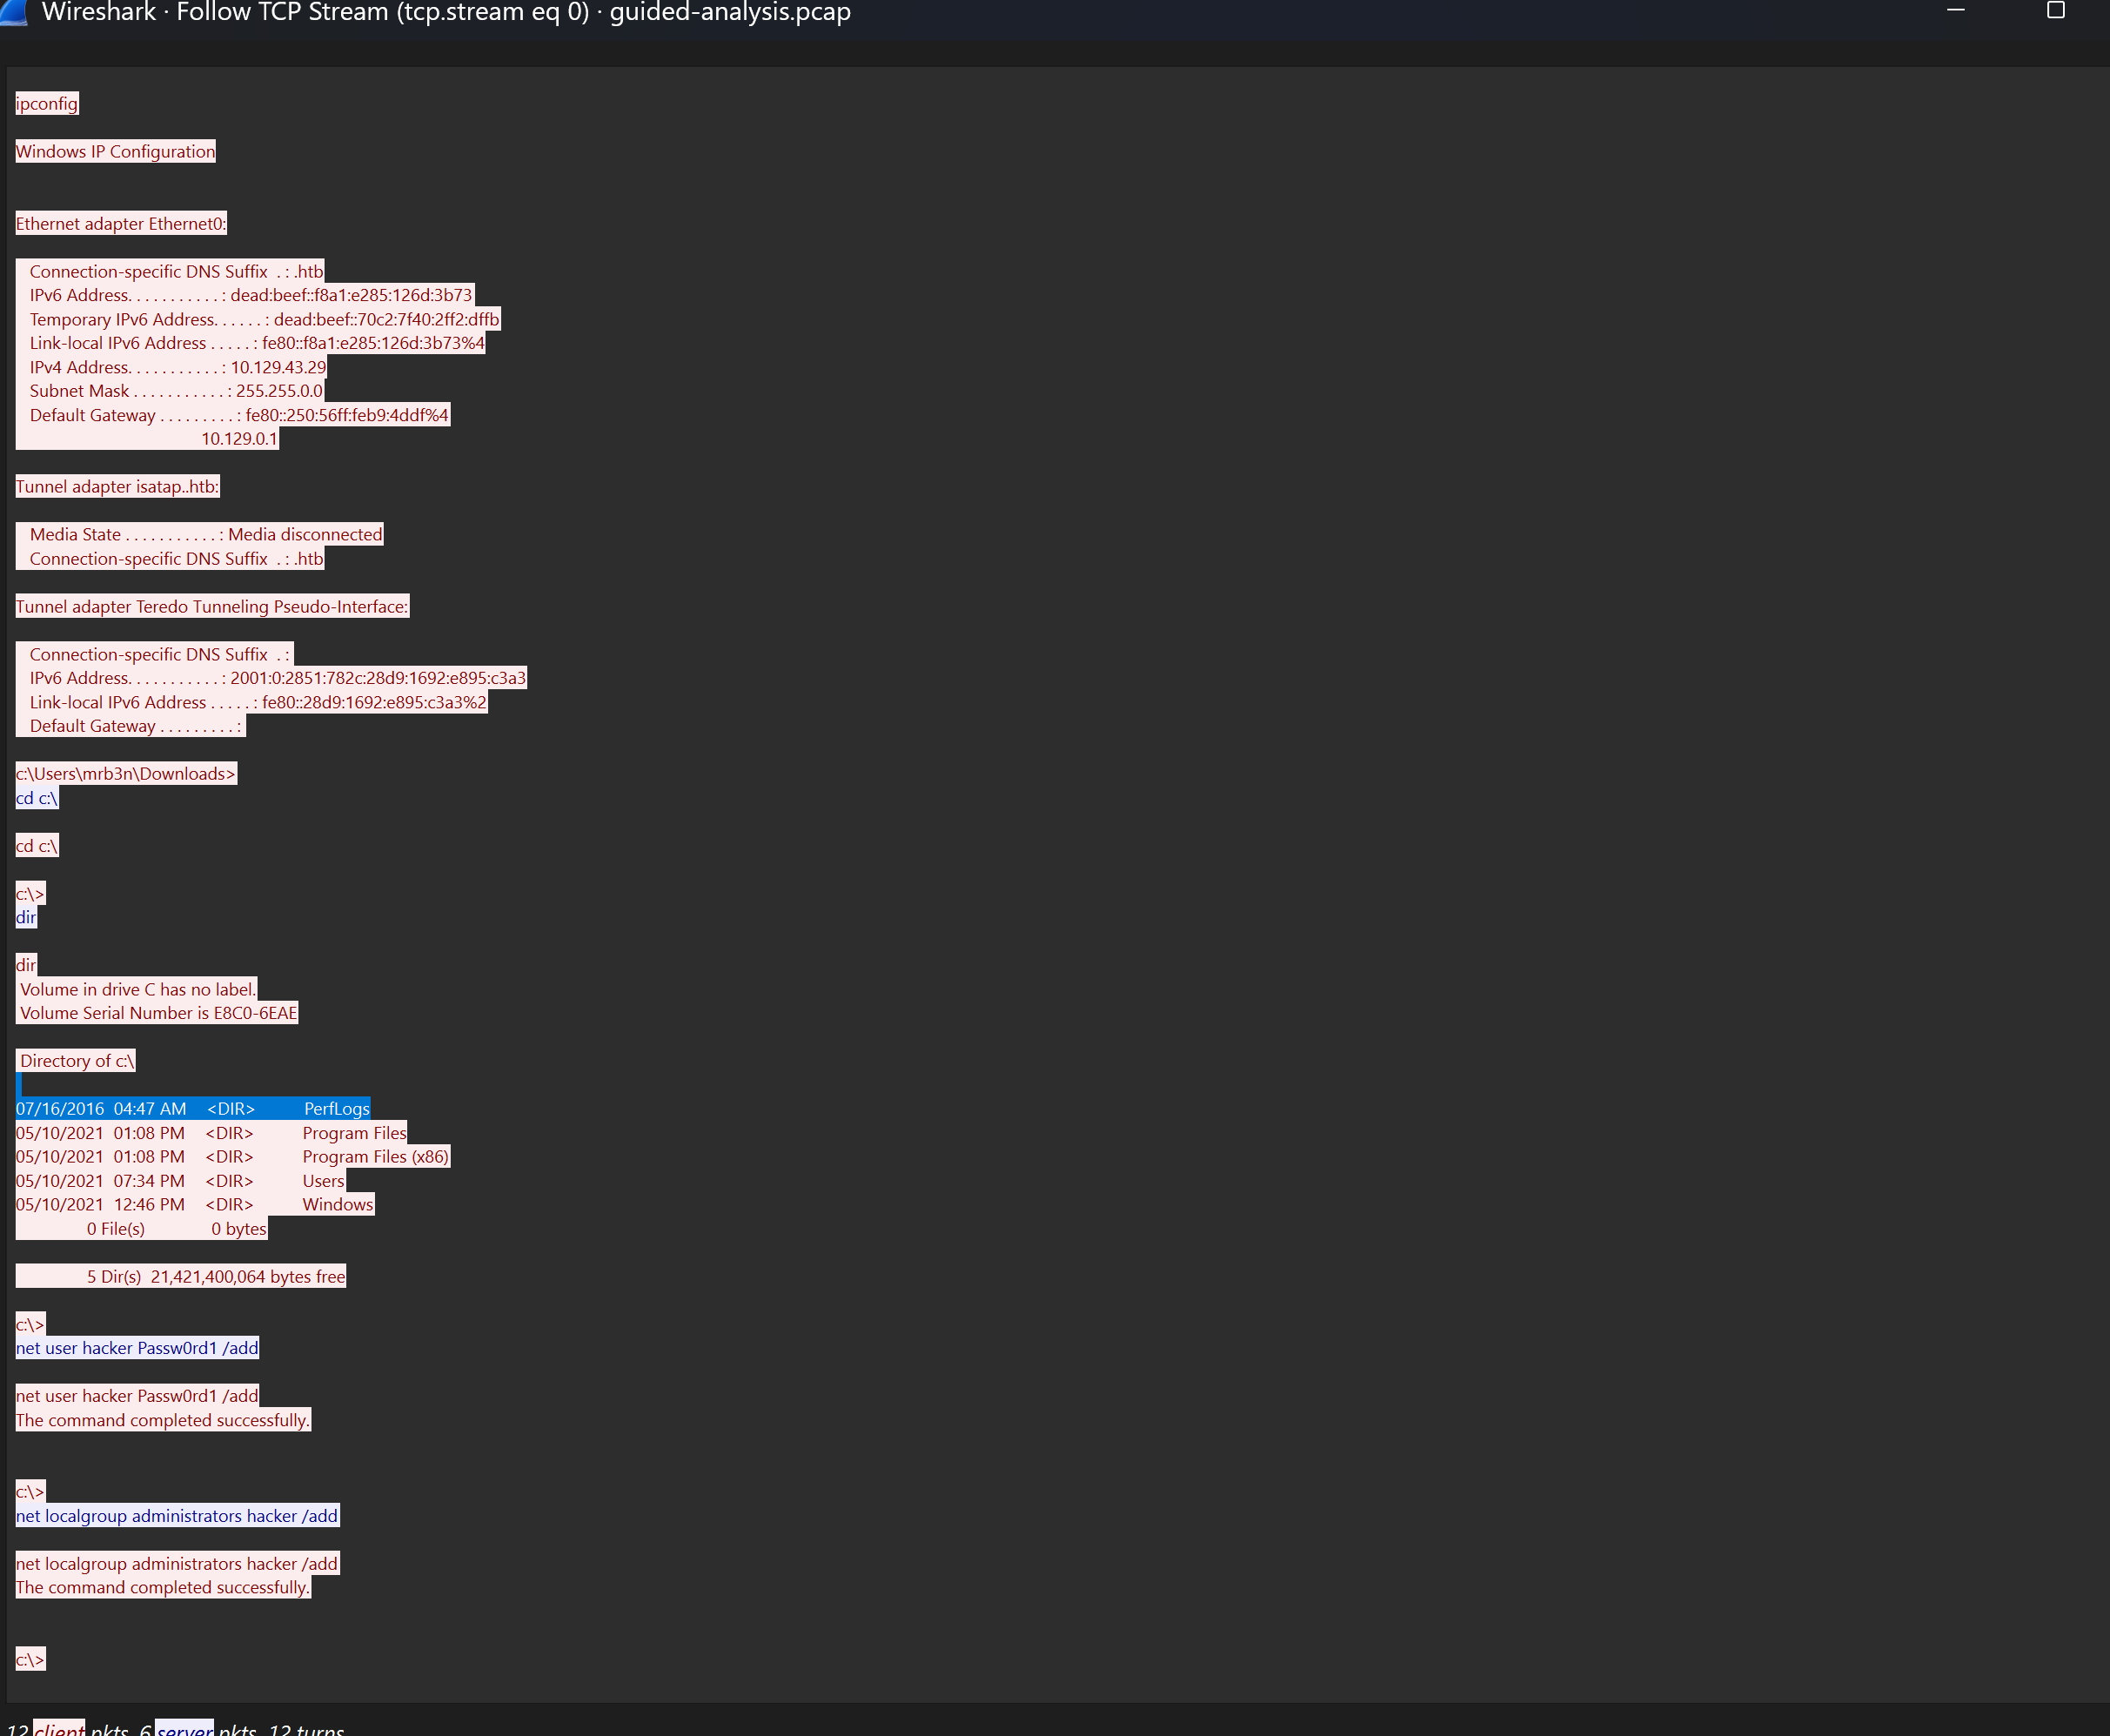
Stream findings. The stream shows basic host recon - commands like whoami, ipconfig, and dir (highlighted in orange), where the actor is figuring out which user they landed as and surveying the host. More alarming: they created an account named hacker and added it to the administrators group via net commands - a strong sign of infiltration, not an admin’s mistake.
Note-taking / mind-mapping. Annotate everything you see and find as you go, with screenshots and a diagram of the action flow. This documentation supports the response decision.
Summary. A malicious actor has compromised at least one host. 10.129.43.29 shows command execution including user creation and local-admin assignment via net. The actions appear to run through Bob’s host - and since Bob was already under investigation for disguising data exfil as web traffic, the issue has likely spread. Recommendation: IR should be initiated to contain the threat.
Decrypting RDP Connections
The last lab continued directly from that case.
When performing IR and analysis on Bob’s machine, the IR team captured some PCAP of the RDP traffic they noticed from Bob’s host to another host in the network. We were asked to investigate. While combing his host for further evidence, an RDP key was found hidden in a folder hive on Bob’s host. After some research, we realized we could use that key to decrypt the RDP traffic and inspect it.
First, showing that a session was actually established, with the filter:
tcp.port == 3389
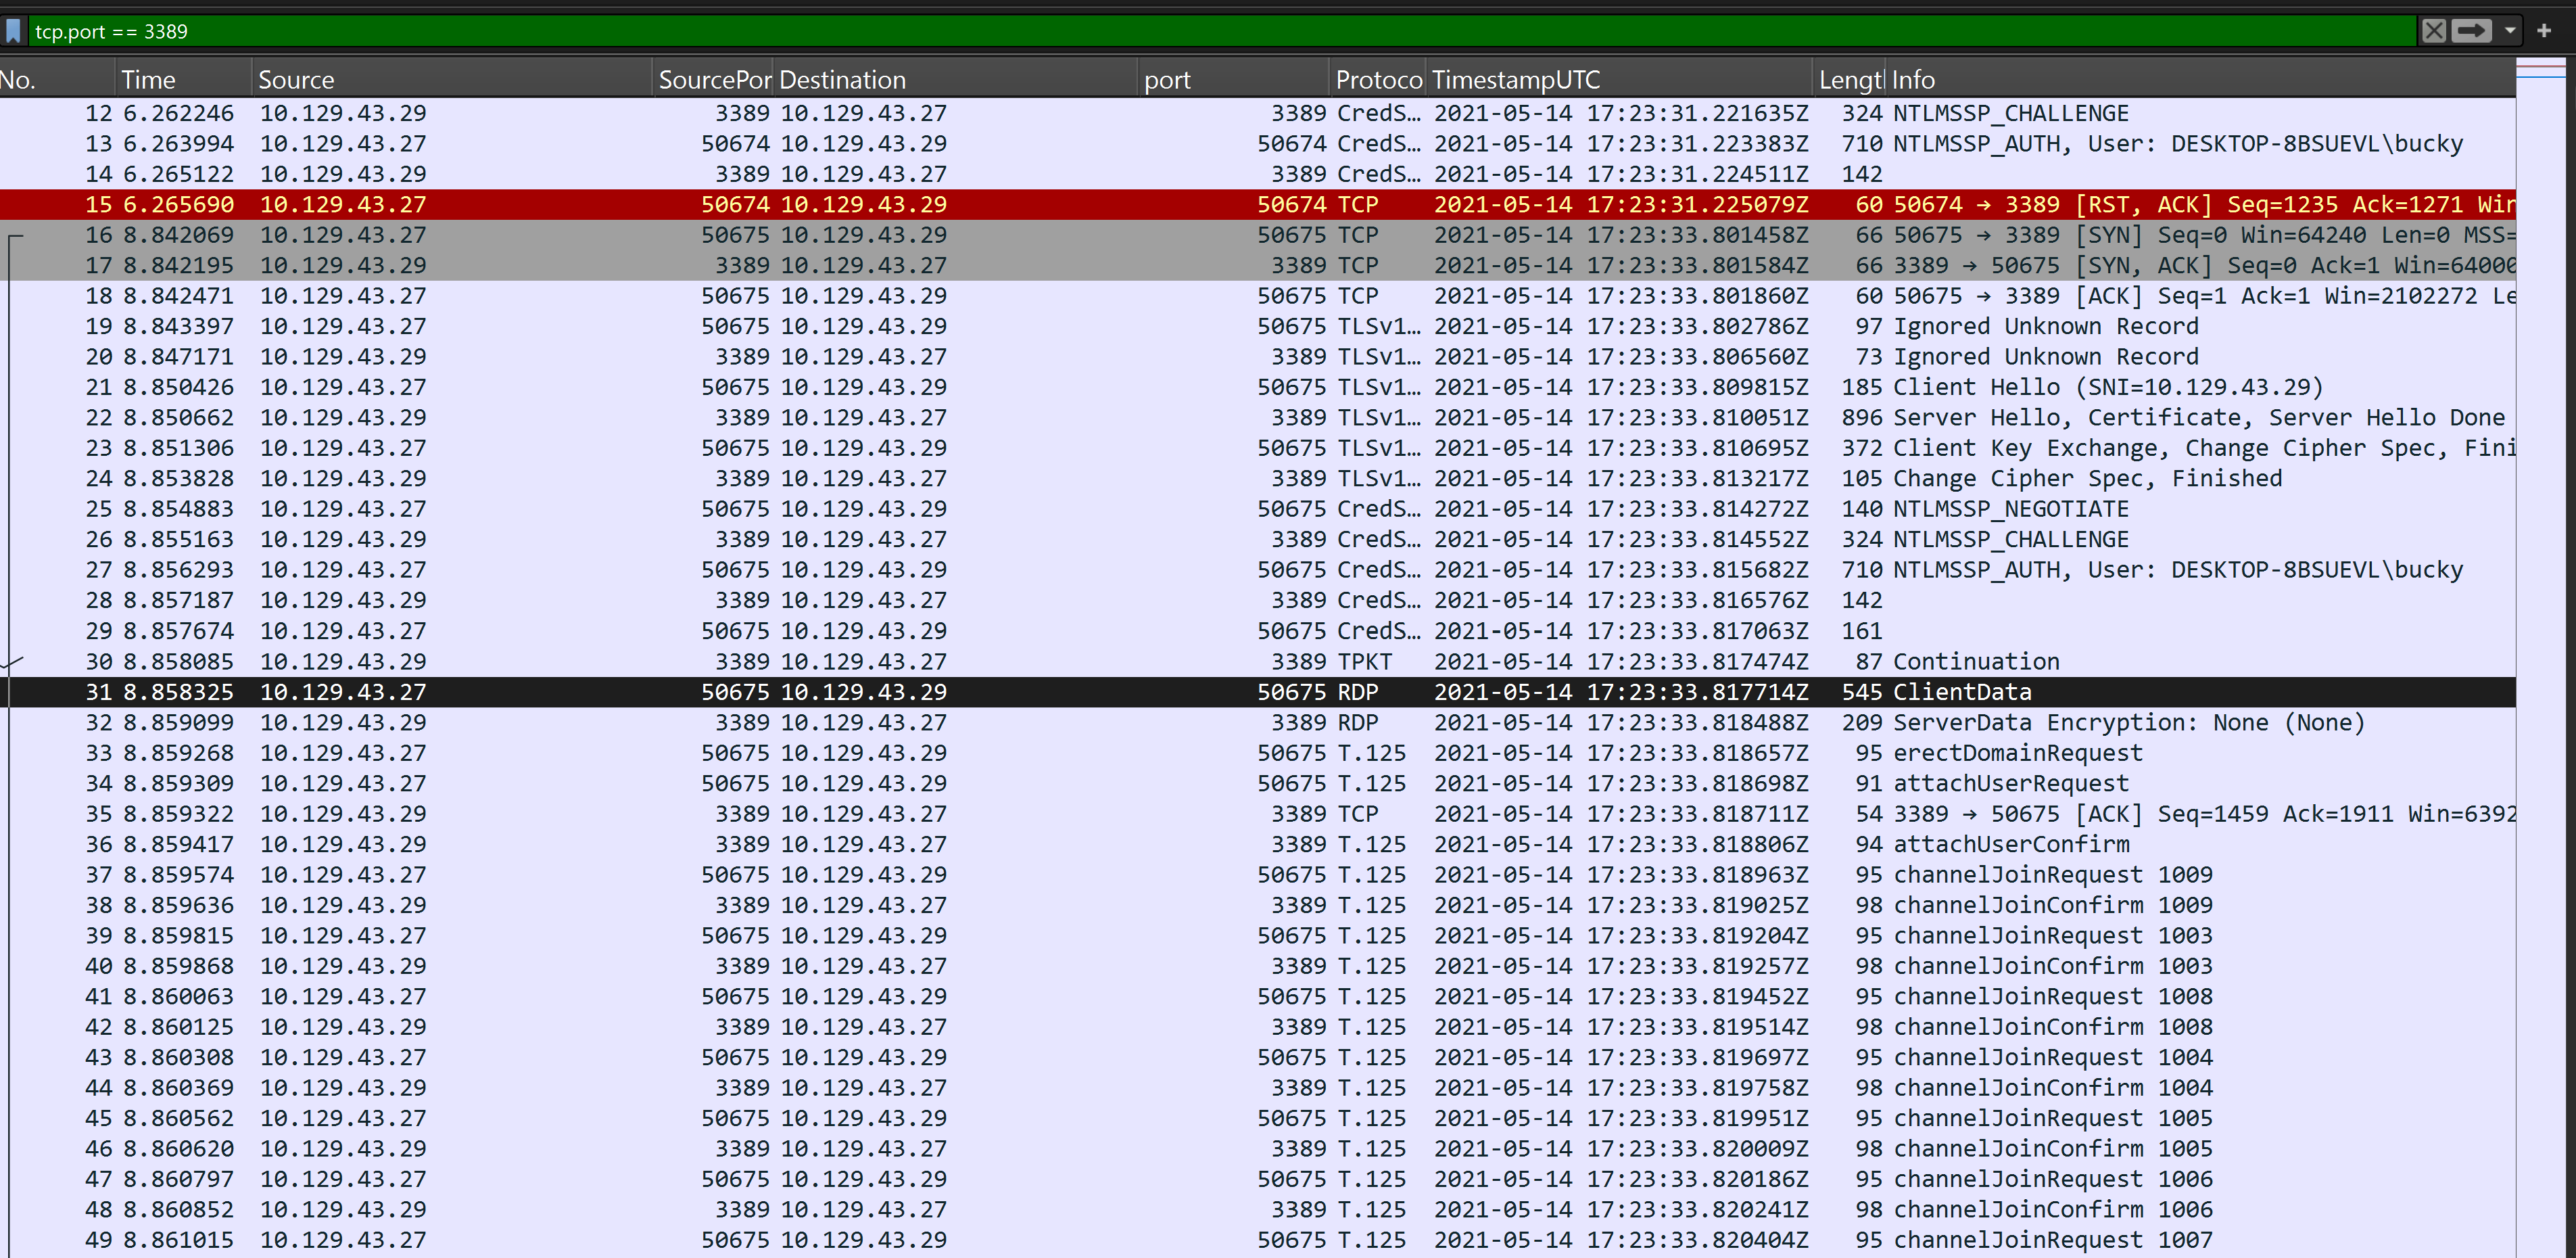
So with tcp.port == 3389 it is confirmed that an RDP session was established between client 10.129.43.27 and server 10.129.43.29, even though the payload shows as TLSv1.2 (encrypted) rather than readable RDP.
Why we need the key. We need the server’s RSA private key (server.key, for 10.129.43.29) so Wireshark can decrypt the TLS-encrypted RDP traffic and we can read what happened in the session. Why it works: RDP used RSA key exchange, so the server’s private key can unlock the recorded session after the fact - turning the encrypted TLSv1.2 packets back into readable RDP.
Import the key:
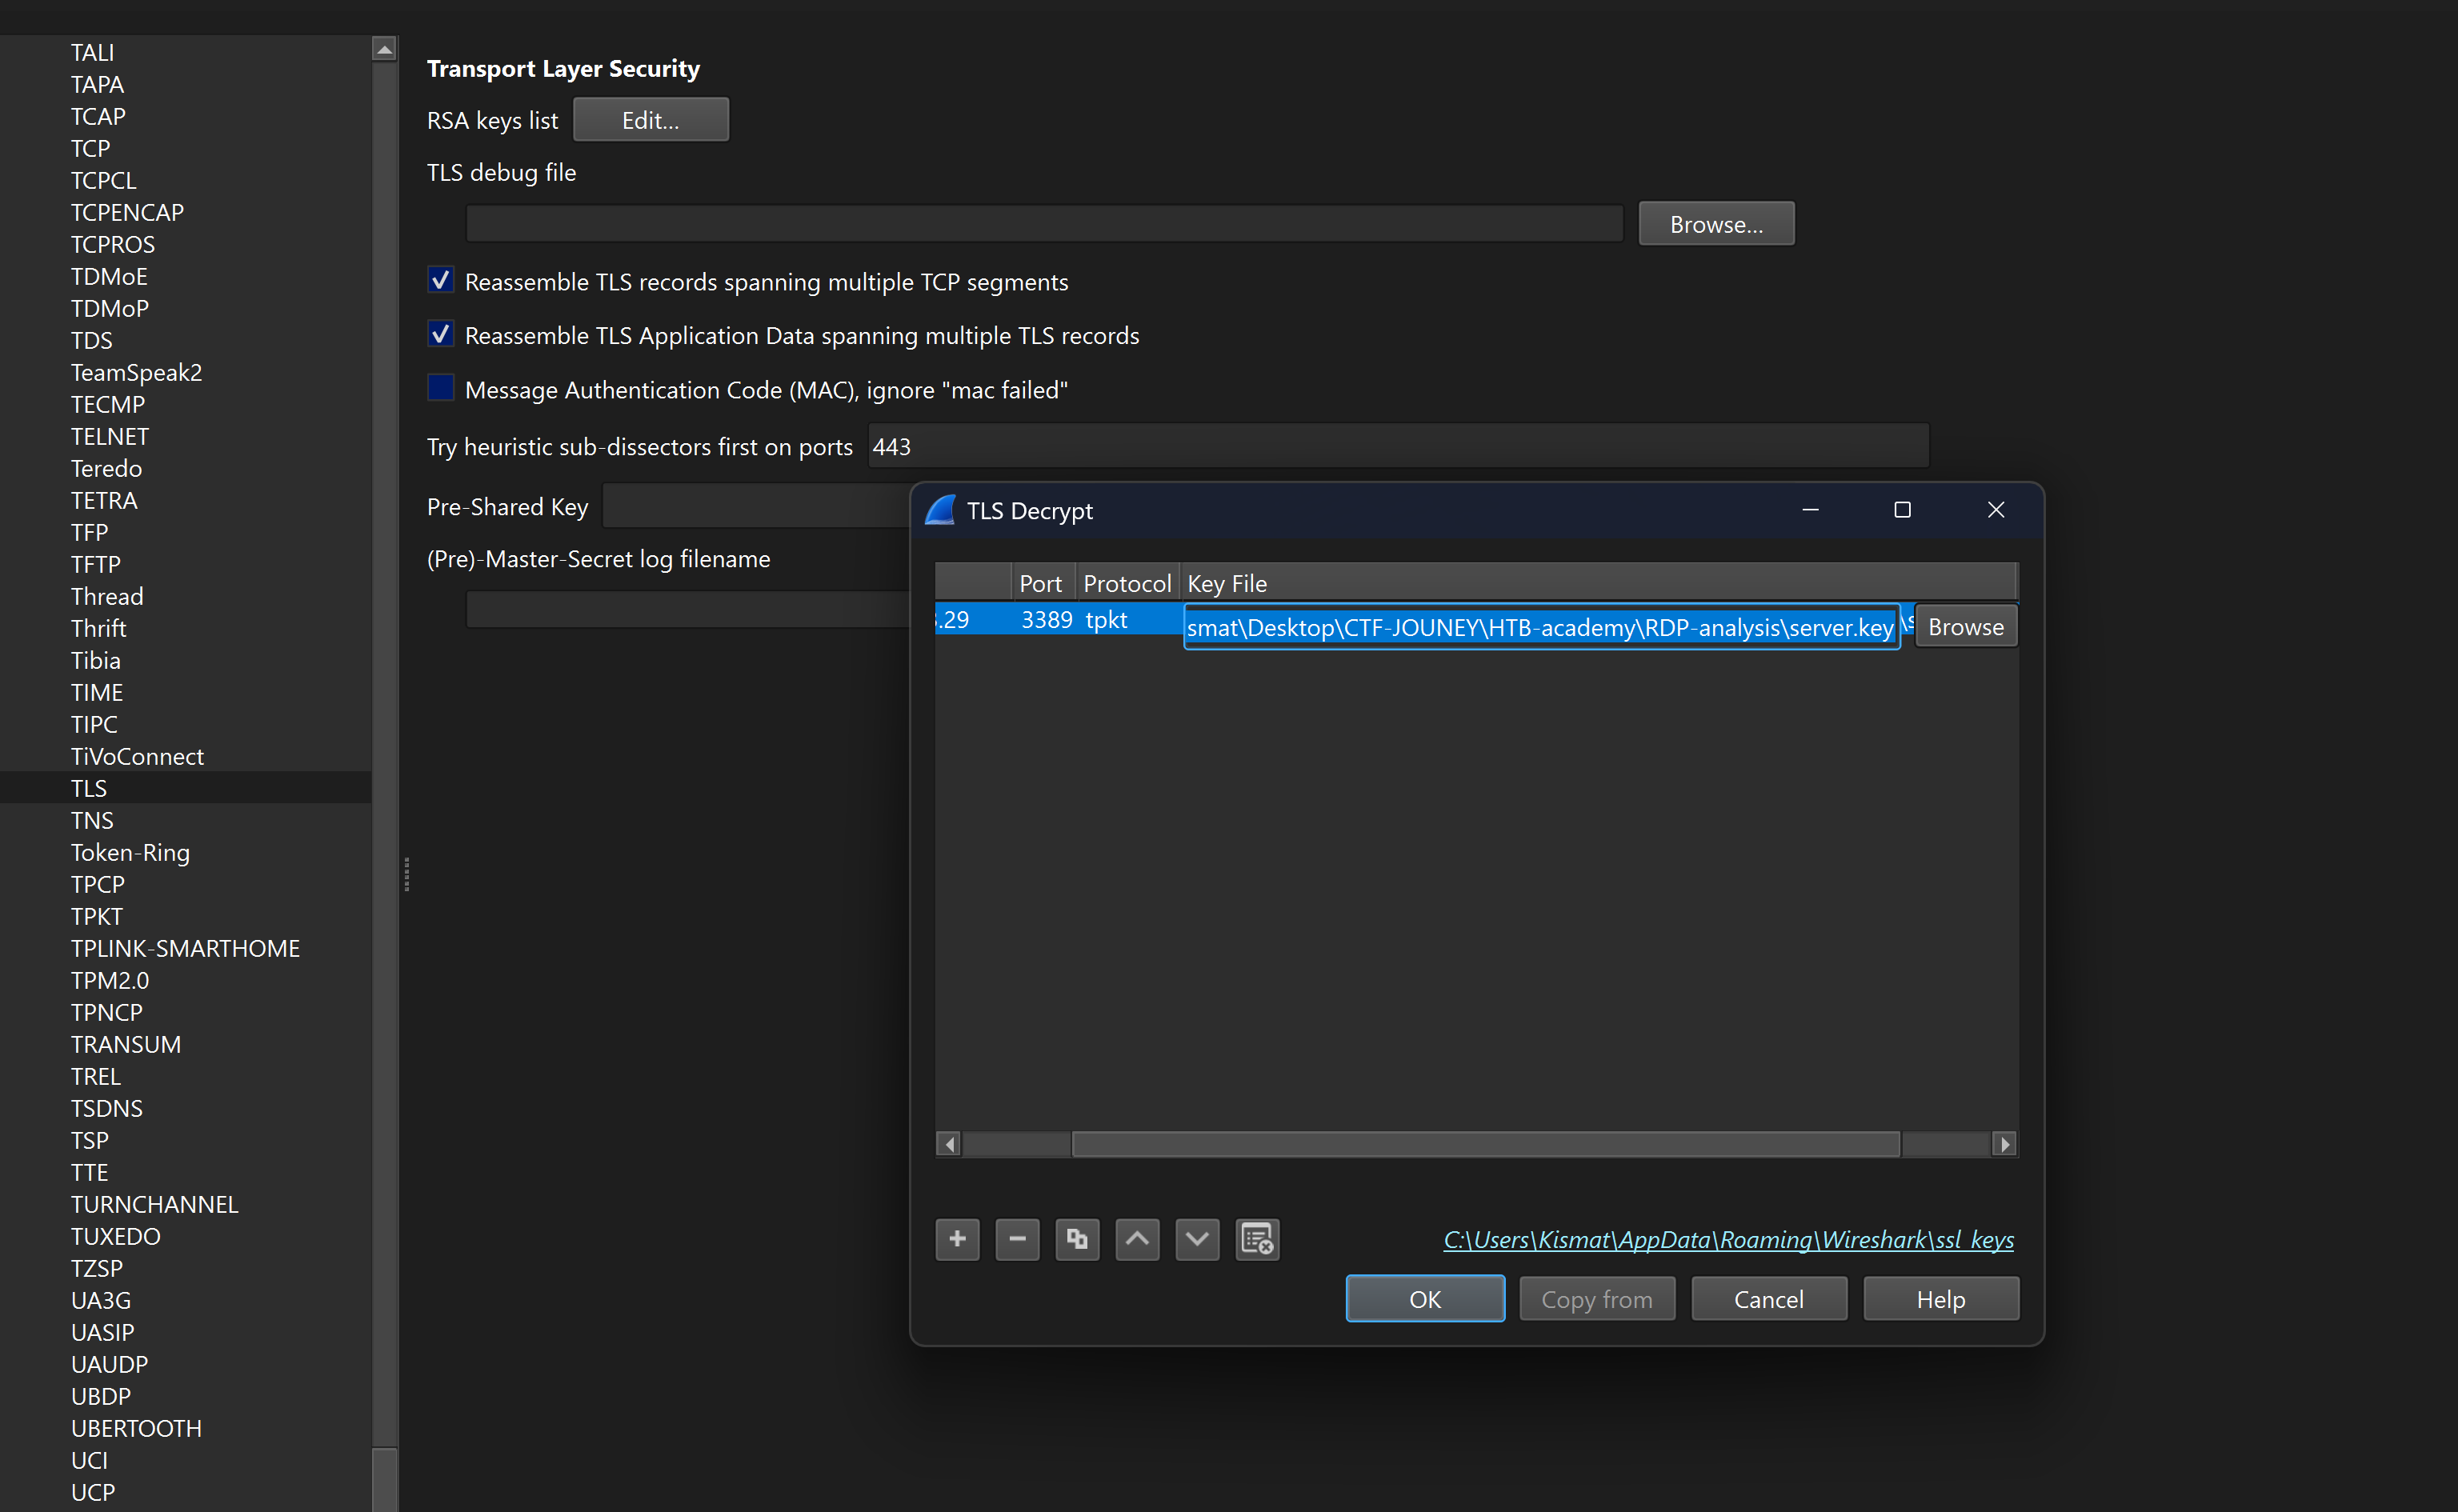
- Edit -> Preferences -> Protocols -> TLS -> RSA keys list: Edit -> new window.
- Click + and add: IP
10.129.43.29, Port3389, Protocoltpkt(or blank), Key Fileserver.key. - OK -> OK, and the pcap refreshes.
For this lab, decryption works, but this stream has no session content to recover - it authenticated as bucky then immediately RST (packet #15) before any RDP activity. If there had been any activity, we could have read it. The value here is the technique: with the server’s RSA key, the rdp filter that returned nothing before now shows the decrypted RDP PDUs in the clear, as shown below.
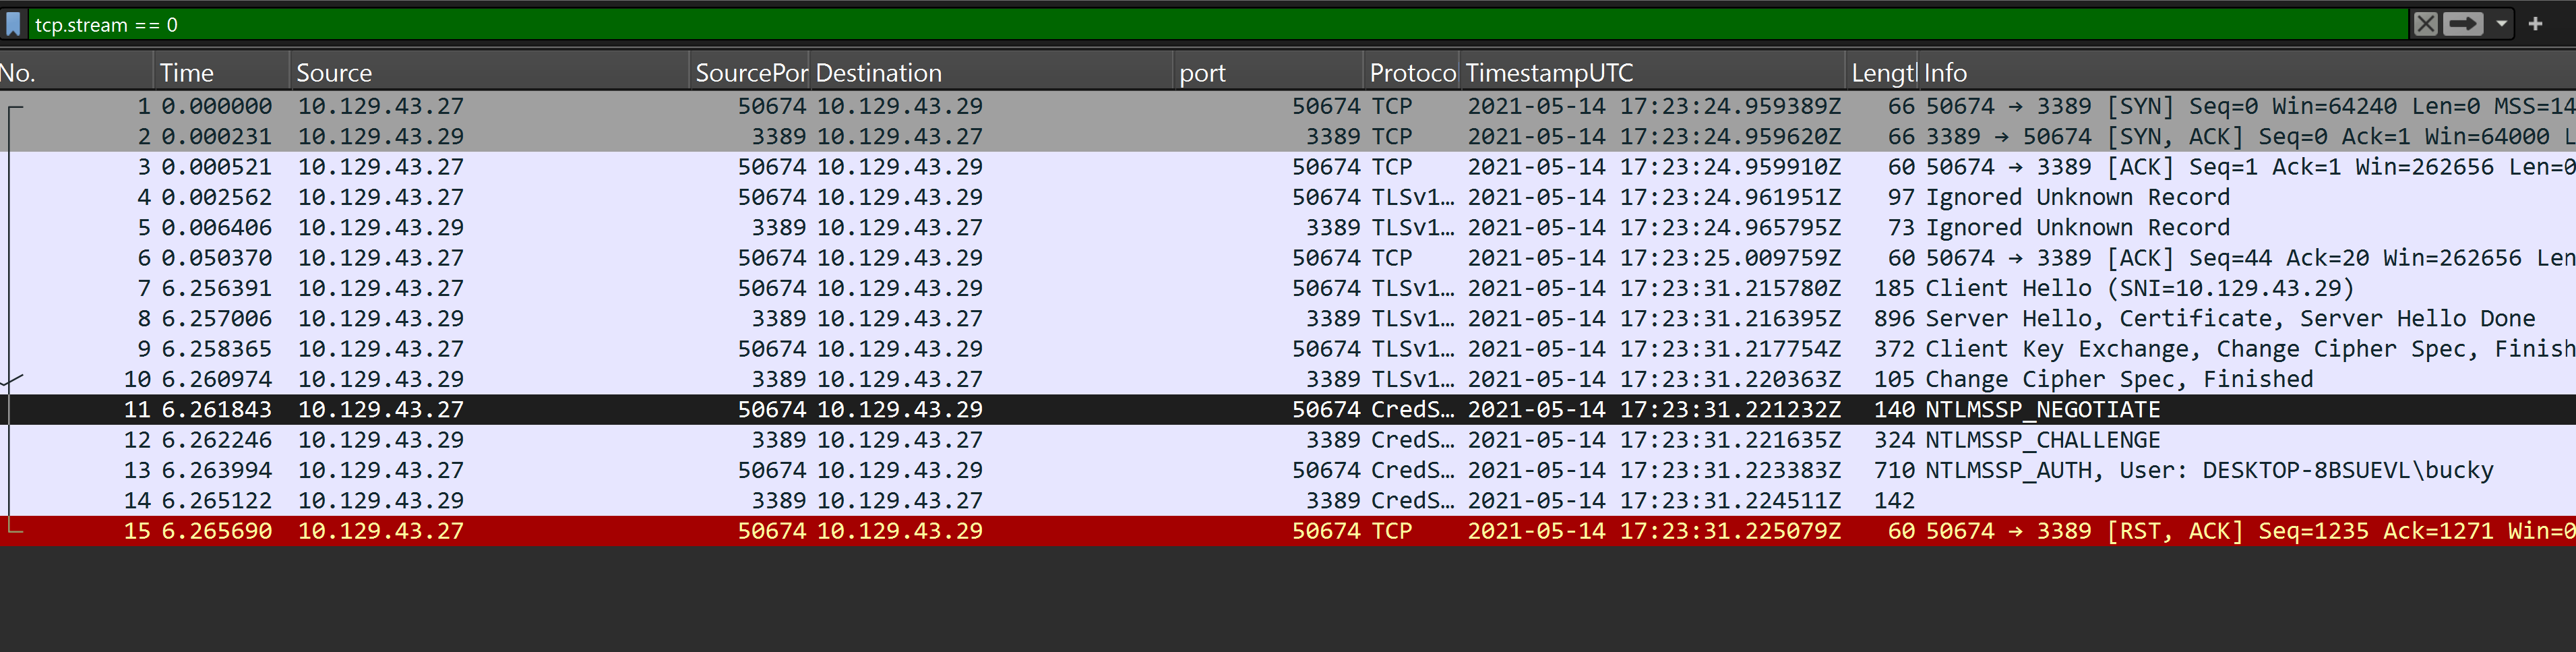
We are clear on the addressing: source ephemeral port on the client, destination port 3389 on 10.129.43.27 / 10.129.43.29.
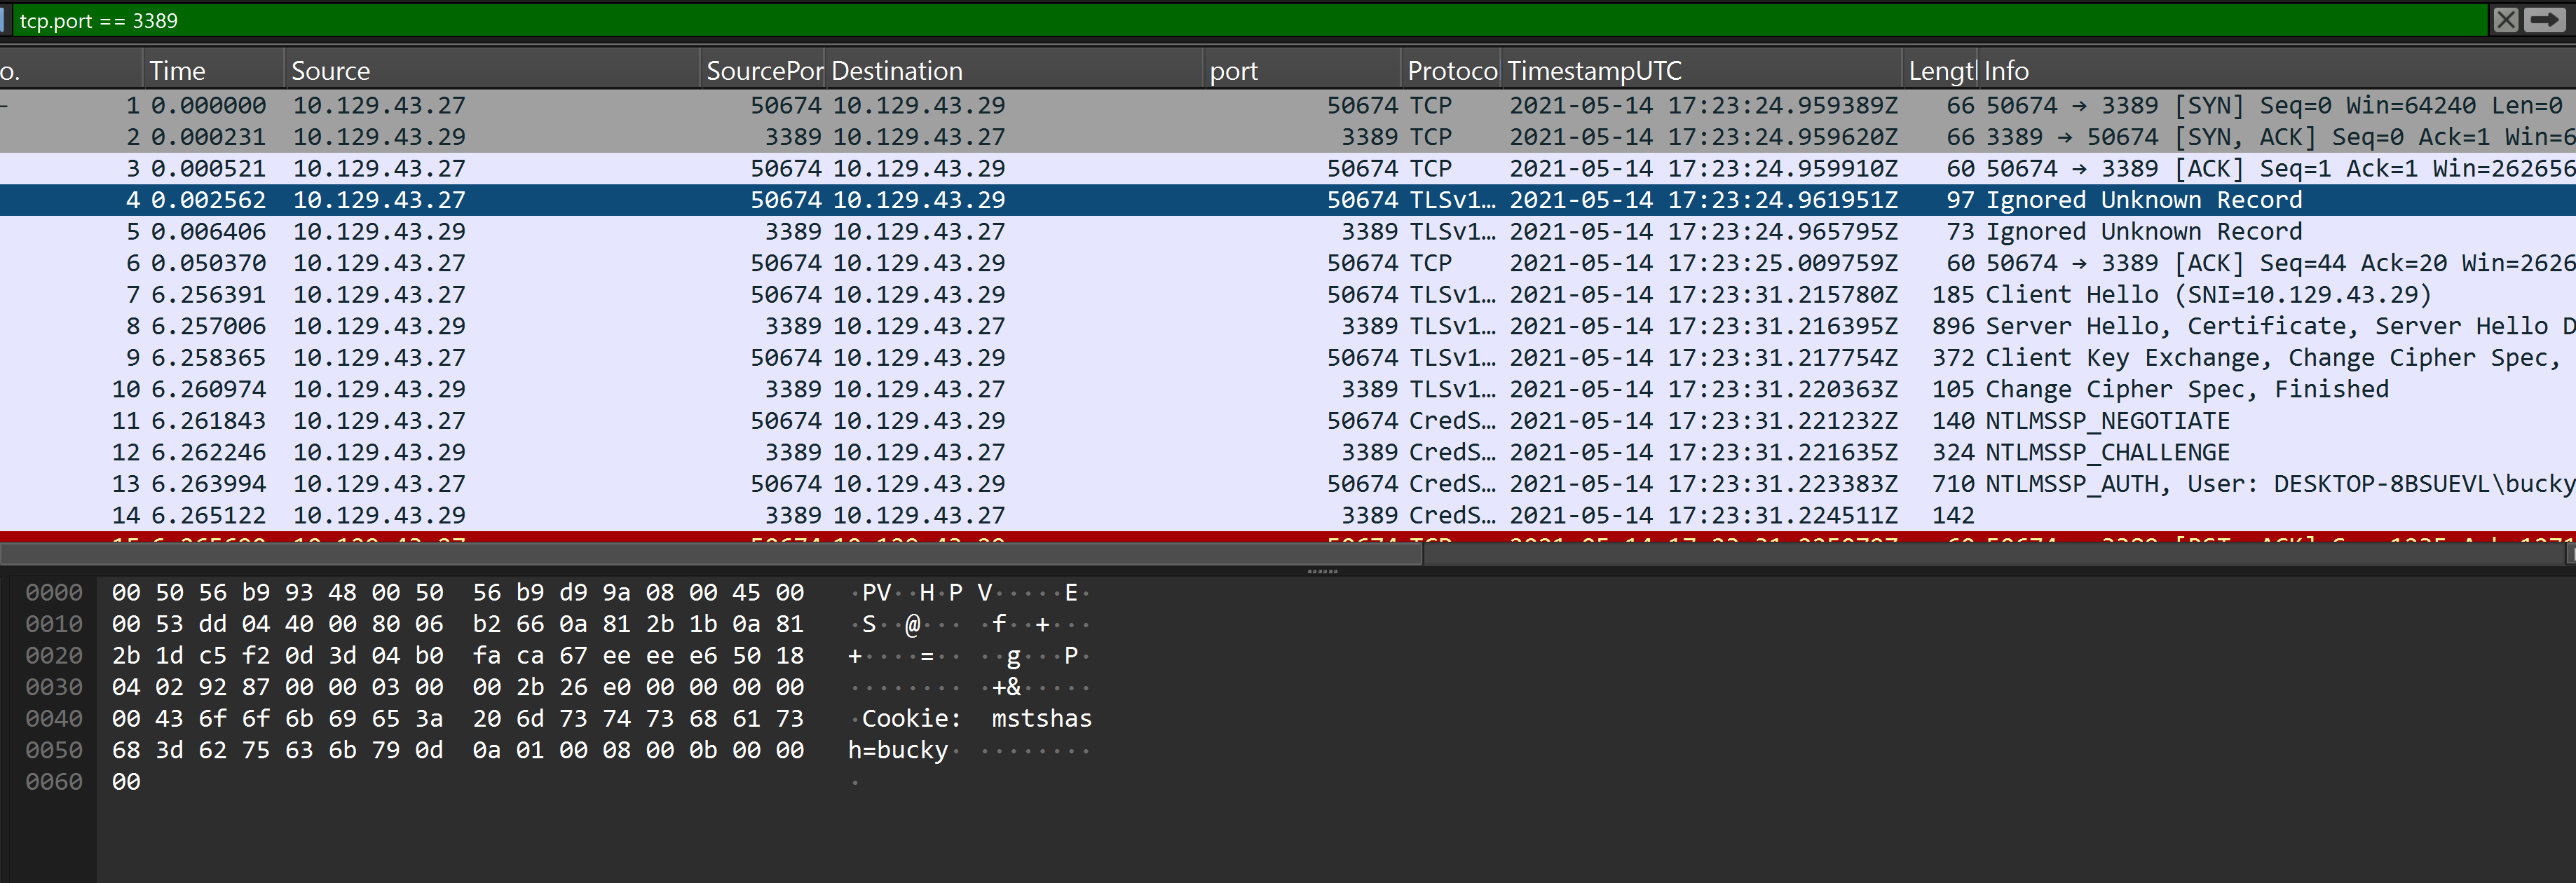
Which user initiated the RDP session? - bucky. Packet #4 (“Ignored Unknown Record”) is the RDP connection request, sent before TLS starts, so it’s in cleartext. The hex/ASCII pane shows the mstshash cookie: mstshash=bucky - that’s the username. Confirmed in packet #13 (NTLMSSP_AUTH): DESKTOP-8BSUEVL\bucky. This can also be seen in the earlier stream commands.
Key Takeaway
- The theory (OSI/TCP-IP, encapsulation, TCP vs UDP, protocol ports) was revision for me. The useful part was the hands-on filtering and file carving.
tcpdumpwithawk/grepworks a PCAP end to end: count packets, split by protocol, rank ports, find the first full handshake, pull DNS answers and HTTP headers - no GUI needed.- In Wireshark I mostly used Statistics -> Conversations (who talks to who), Statistics -> Protocol Hierarchy (what), and Follow TCP Stream (read a conversation in order).
- HTTP and FTP are cleartext, so files and credentials come straight out: Export Objects for HTTP, and RETR -> ftp-data -> Follow Stream (Raw) for FTP.
- Port 4444 case: filter to the host in scope, confirm the connection is still active (no RST), then follow the stream - it showed
whoamirecon andnet user hackeradding an account to administrators. - RDP: import the server’s RSA private key into Edit -> Preferences -> Protocols -> TLS, and
TLSv1.2on port 3389 decrypts to readable RDP PDUs. This stream RST’d early so there was nothing to read, but the method works for any TLS session where you hold the key.
References
- HTB Academy - Intro to Network Traffic Analysis
- Wireshark - Sample Captures
- Wireshark - Display Filter Reference
- tcpdump man page