Module 4: Understanding Log Sources & Investigating with Splunk
The SPL queries on this page are from the practical exercises in each module section. I consolidated them here so they are easier to reference later.
This module covered Splunk architecture, SPL fundamentals, app deployment, and threat hunting across large datasets. I kept the Skill Assessment and additional hunting queries on separate pages because those walkthroughs are longer and more command-heavy.
Module 4 Navigation
On this page
- Splunk overview
- Core architecture
- Splunk ecosystem
- SPL essentials
- Data and field identification
- Configuring Splunk apps
- Network-scale threat hunting
- High-fidelity alerting
- Spot the Known
- Spot the Unusual
- Key Takeaway
- Where AI Can Help
- References
- Skill Assessment
Skill Assessment
Additional queries
Consolidated SPL from the module exercises, organized for reuse: spl-threat-hunting-library on GitHub
Splunk overview
Splunk is a highly scalable data analytics platform engineered to ingest, index, analyze, and visualize massive volumes of machine data. While widely utilized for IT monitoring and compliance, its capabilities as an analytics-driven Security Information and Event Management (SIEM) solution make it a critical tool for cybersecurity monitoring, incident response, and threat hunting.
Core Architecture Components
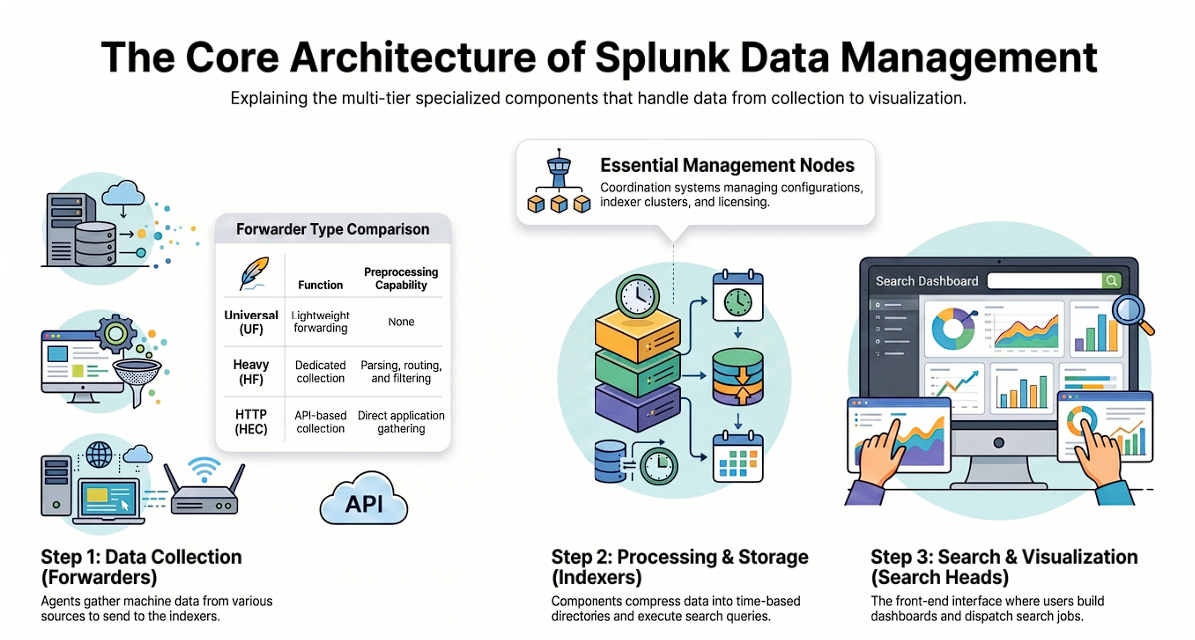
Splunk processes data through a multi-tier architecture, dividing tasks across specialized components:
- Forwarders (Data Collection): These agents gather machine data from various sources and forward it to the indexers.
- Universal Forwarders (UF): Lightweight agents that forward data without any preprocessing.
- Heavy Forwarders (HF): Dedicated data collection nodes capable of parsing, routing, and filtering data before forwarding.
- HTTP Event Collectors (HEC): Highly scalable collectors that gather data directly from applications using token-based JSON or raw APIs.
- Indexers (Data Processing & Storage): Indexers receive data from forwarders, compress it into time-based directories, and process user search queries.
- Search Heads (User Interface): The front-end system where users dispatch search jobs, build dashboards, and manage Knowledge Objects without altering the original index data.
- Management Nodes: Essential coordination systems, including the Deployment Server (manages forwarder configurations), Cluster Master (coordinates indexers in clustered environments), and License Master.
Once the data path made sense, the module moved into how Splunk packages that data for daily use.
The Splunk Ecosystem
- Apps and Add-ons: Apps provide specific functionalities and comprehensive workspaces catering to different use cases. Technology Add-ons operate beneath the surface to handle data collection methods, field extractions, and configuration files.
- Knowledge Objects: These are user-defined entities (tags, lookups, event types, macros, and data models) that enrich the data and make it easier to query without modifying the raw logs.
Architecture tells you where logs land. SPL is how you actually question them.
Search Processing Language (SPL) Essentials
The Search Processing Language (SPL) is the backbone of data analysis in Splunk, containing over a hundred commands for filtering and transforming data. Below is a reference table for the most critical foundational commands:
| Command | Description | Example Usage |
|---|---|---|
search |
Filters events. It is implicitly applied at the start of most queries but can be written explicitly. Supports boolean operators (AND, OR, NOT). | search index="main" "UNKNOWN" |
fields |
Specifies which fields to include or exclude (-) in the results. |
... \| fields host, ComputerName |
table |
Formats output into structured columns based on selected fields. | ... \| table host, Image, CommandLine |
rename |
Modifies the display name of a field in the output. | ... \| rename ComputerName AS Host |
dedup |
Removes duplicate events based on a specified field. | ... \| dedup host |
sort |
Orders results chronologically or numerically. Use - for descending. |
... \| sort - _time |
stats |
Performs statistical operations, such as counting events by specific criteria. | ... \| stats count by Image |
chart |
Prepares statistical data for visual graphs, grouping data into unique rows and columns. | ... \| chart count by Image |
eval |
Creates new custom fields or redefines existing ones (e.g., forcing lowercase). | ... \| eval len=len(CommandLine) |
rex |
Extracts entirely new fields from raw event data using Regular Expressions. | ... \| rex field=Details "(?<file>[^\\]+)$" |
lookup |
Enriches indexed data by matching it against an external file, like a CSV. | ... \| lookup asset_lookup ip AS dest_ip |
transaction |
Groups related events sharing common characteristics over a specified time window, useful for tracking sessions. | ... \| transaction ComputerName, Image |
[ ] (Subsearch) |
Nests a search to compute a set of results that filter the outer main search. | ... NOT [ search index="main" ... ] |
I was honestly overwhelmed with queries and what you could do with it, but yes and accepted it takes time in practice and moved on.

SPL commands only help if you know what indexes, sourcetypes, and fields you actually have. The module covered two ways to find that out.
Data and Field Identification
Effectively leveraging Splunk requires understanding what data is actively being ingested. There are two primary approaches to discovering data sources, sourcetypes, and fields:
Method 1: Utilizing SPL Queries
Using SPL allows for rapid, granular discovery of the environment:
List all Indexes
| eventcount summarize=false index=* | table index
List all Sourcetypes
| metadata type=sourcetypes index=* | table sourcetype
List all Data Sources
| metadata type=sources index=* | table source
Summarize Field Metrics
sourcetype="WinEventLog:Security" | fieldsummary
Identify Rare Anomalies
index=* sourcetype=* | rare limit=10 index, sourcetype
Method 2: Utilizing the Web Interface
The UI helps a lot actually with understanding fields and making up queries.
The Splunk UI provides built-in visual tools to map out available data structures:
- Data Inputs: Accessible via Settings > Data inputs, this section lists all active origin points for incoming data, including scripts, forwarders, and HTTP event collectors.
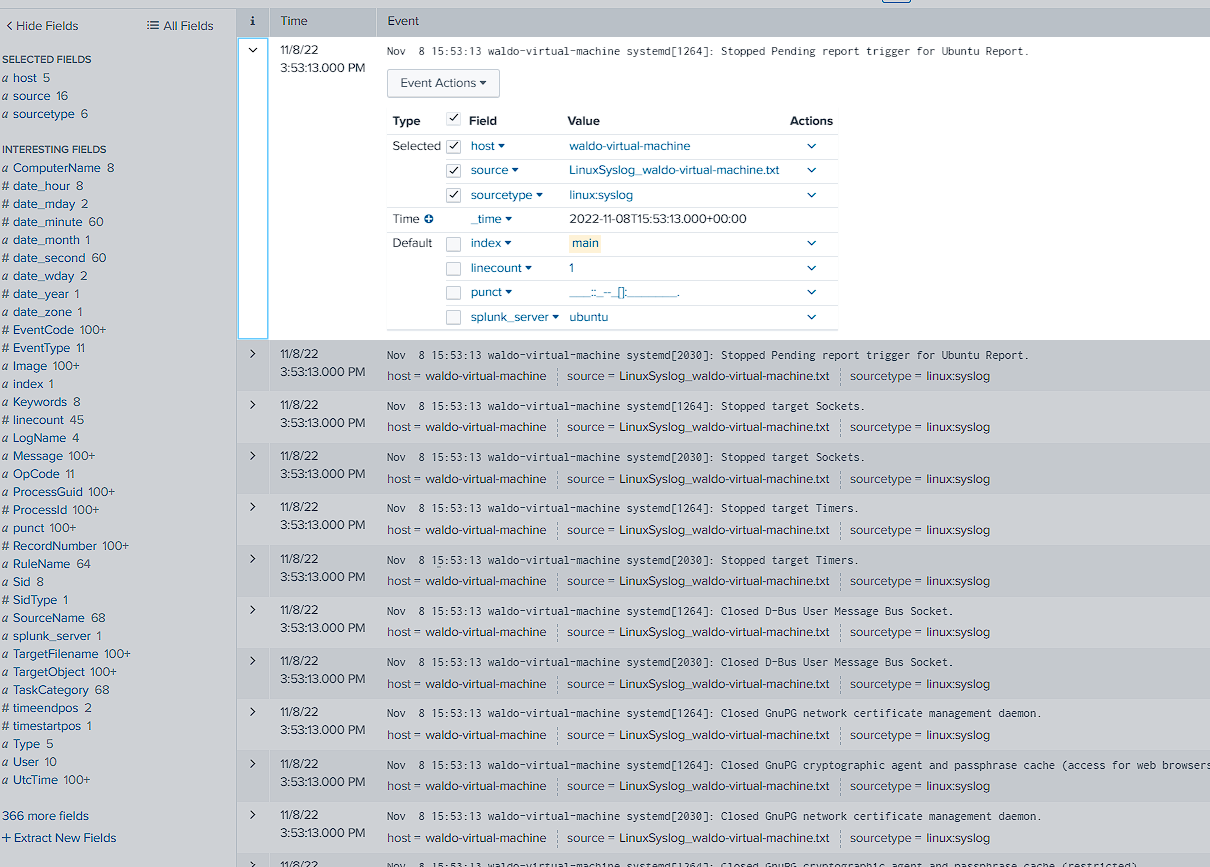
- Search Modes: The interface offers Fast mode for rapid data scanning, and Verbose mode for deep inspection of raw events, “Selected Fields,” and “Interesting Fields”.
- Data Models & Pivots: Located under Settings > Data Models, these provide a hierarchical, structured view of complex datasets. The Pivot feature allows users to interact with Data Models via a drag-and-drop interface, enabling the creation of complex reports without requiring manual SPL scripting.
After discovery, the module walked through deploying a Sysmon app and pointing dashboards at the right index and sourcetype.
Configuring and Deploying Splunk Applications
- What are Splunk Apps? Available on Splunkbase, apps are pre-built knowledge packages that extend Splunk with custom dashboards, alerts, and inputs tailored to specific technologies or use cases (like SIEM for security operations).
- Deployment Requirements: Because apps introduce additional workloads, you must evaluate hardware sizing, anticipate increased daily data volumes, and ensure you have the appropriate licenses before installation.
- Installation & Configuration (Sysmon App Example):
- Install: Download the app package from Splunkbase and upload it via the Splunk interface using “Manage Apps > Install app from file”.
- Configure: Update the app’s search macros (found in Settings > Advanced Search) so they point to your environment’s exact data location, such as
index="main" sourcetype="WinEventLog:Sysmon". - Troubleshoot: If a dashboard panel returns “No results found,” you can fix it by editing the panel’s search string to match your log’s exact field names (e.g., changing
ComputertoComputerName).
From there the module shifted into hunting. Module 3 was mostly one machine and raw event review. Here the dataset was over 500,000 events across the network, and the point was to trace TTPs by pivoting search to search instead of staring at one log stream.
The core of this methodology rests on three pillars:
- Query Efficiency: Prioritizing targeted searches over generalized regex or wildcard queries to reduce resource consumption and improve return times.
- Sysmon Intelligence: Leveraging specific Event IDs to identify anomalies such as irregular parent-child process hierarchies, credential dumping via
lsass.exe, and DCSync attacks depending upon what you are looking for. - High-Fidelity Alerting: Crafting resilient alerts by systematically filtering out “benign noise” from Just-In-Time (JIT) compilers and system processes, specifically focusing on calls from “UNKNOWN” memory regions that often indicate shellcode execution.
Earlier I only did event analysis on Windows. Now doing it on more event logs from many machines is very fun.
Optimization of Search Queries
Effective hunting hinges on crafting queries that target relevant data while minimizing extraneous noise. Search performance varies significantly based on query structure:
- Generalized Queries: Using broad terms is slow and resource-intensive because it performs regex searches across all fields.
index="main" *string*
- Targeted Queries: Restricting searches to specific fields returns results much more quickly and reduces impact on the SIEM environment.
index="main" ComputerName="*string*"
The walkthrough below is what the module used on the HTB Academy lab data. Same pivot pattern throughout: one finding leads to the next question.
Network-Scale Threat Hunting
Phase 1: Spotting the Initial Anomaly (Process Monitoring)
Step 1: Identify Available Data
-
The Pivot: Baseline what Sysmon event types exist in the dataset before hunting specific behaviors.
-
The Query:
index="main" sourcetype="WinEventLog:Sysmon" | stats count by EventCode
- The Discovery: We find 20 distinct Event Codes, with Event ID 1 (Process Creation) being highly useful for spotting abnormal parent-child process hierarchies.
Step 2: Hunt for Abnormal Process Trees
-
The Pivot: From high-volume Event ID 1 activity, pivot into parent-child pairs for
cmd.exeandpowershell.exe. (This step can totally differ depending on incident, alert or threat intel.) -
The Query:
index="main" sourcetype="WinEventLog:Sysmon" EventCode=1 (Image="*cmd.exe" OR Image="*powershell.exe") | stats count by ParentImage, Image
- The Discovery: We immediately spot an anomaly:
notepad.exe(a text editor) spawnedpowershell.exe.
Step 3: Deep Dive into the Anomaly
-
The Pivot: From
notepad.exespawningpowershell.exe, isolate the exact command line and download activity. -
The Query:
index="main" sourcetype="WinEventLog:Sysmon" EventCode=1 (Image="*cmd.exe" OR Image="*powershell.exe") ParentImage="C:\Windows\System32\notepad.exe"
- The Discovery: The logs reveal PowerShell executed an
Invoke-WebRequestcommand to silently download an executable (file.exe) from an internal IP address:http://10.0.0.229:8080into a user’s Downloads folder.
Phase 2: Tracing Lateral Movement
The download came from http://10.0.0.229:8080. Next I needed to know what that host was and which other machines talked to it.
Step 4: Pivot to the Malicious IP
-
The Pivot: From the internal download host
10.0.0.229, query that IP across all sourcetypes to identify the compromised system. -
The Query:
index="main" 10.0.0.229 | stats count by sourcetype
-
The Discovery: The IP shows up in
linux:syslogdata. Running a follow-up query reveals this IP belongs to a Linux machine namedwaldo-virtual-machine. The attacker has compromised a Linux server to host malware. -
Follow-up pivot: Confirm the Linux host identity in
linux:syslog. -
Follow-up query:
index="main" 10.0.0.229 sourcetype="linux:syslog"
Step 5: Identify All Victims
-
The Pivot: From the compromised Linux host at
10.0.0.229, pivot back into Windows Sysmon to see which endpoints downloaded malware or ran follow-on scripts. -
The Query:
index="main" 10.0.0.229 sourcetype="WinEventLog:sysmon" | stats count by CommandLine, host
- The Discovery: Two hosts (
DESKTOP-EGSS5ISandDESKTOP-UN7T4R8) downloaded malicious files, and notably, a DCSync PowerShell script was executed on the second host.
Phase 3: Detecting Full Domain Compromise
A DCSync script on one of the victim hosts meant the hunt was no longer about a single box. I pivoted into AD logs to see if domain credentials were actually at risk.
Step 6: Verify the Privilege Escalation
-
The Pivot: From the DCSync PowerShell activity, pivot into Event Code 4662 to confirm replication rights abuse.
-
The Query:
index="main" EventCode=4662 Access_Mask=0x100 Account_Name!=*$
-
Logic: We filter for Access Mask 0x100, which requests Control Access, and exclude machine accounts
*$since DCSync should normally only be performed by machines or SYSTEM, not standard users. - The Discovery: A standard user (‘waldo’) successfully requested Control Access containing the GUID
{1131f6ad-9c07-11d1-f79f-00c04fc2dcd2}. - The Conclusion: Searching this GUID online confirms it is
DS-Replication-Get-Changes-All, which allows the replication of secret domain data. The network is fully compromised.
Phase 4: Investigating Credential Harvesting (lsass dumping)
The module also stepped back in the timeline. Before DCSync mattered, something had to get credentials off the host in the first place.
Step 7: Look for Memory Dumping
-
The Pivot: To understand how privilege escalation started, pivot into Sysmon Event ID 10 and look for processes accessing
lsass.exe. -
The Query:
index="main" EventCode=10 lsass | stats count by SourceImage
- The Discovery: We again see
notepad.exeimproperly accessinglsass.exe.
Step 8: Inspect the Call Trace
-
The Pivot: From
notepad.exeaccessinglsass.exe, pivot into the call trace to see whether access came from unbacked memory. -
The Query:
index="main" EventCode=10 lsass SourceImage="C:\Windows\System32\notepad.exe"
- The Discovery: The call stack details show an
*UNKNOWN*memory region accessinglsass. This means the malicious code (shellcode) executed directly from an unbacked region of memory rather than from a physical file on the disk.
Creating a High-Fidelity Alert
The UNKNOWN call trace was a good detection lead, but a raw alert on that string fired 1,575 times. The module then walked through stripping noise out layer by layer before calling it production-ready.
Step 9: Filtering the Alert Step-by-Step
Filter 1: Self-Access
-
The Pivot: Start from raw
*UNKNOWN*call trace hits and remove processes accessing themselves. -
The Query:
index="main" CallTrace=" *UNKNOWN* " | where SourceImage!=TargetImage | stats count by SourceImage
Filter 2: JIT Compilers (.NET/C#)
-
The Pivot: Remove legitimate Just-In-Time compilers that naturally use unbacked memory.
-
The Query:
index="main" CallTrace=" *UNKNOWN* " SourceImage!=" *Microsoft.NET* " CallTrace!= *ni.dll* CallTrace!= *clr.dll* | where SourceImage!=TargetImage | stats count by SourceImage
Filter 3: WOW64
-
The Pivot: Exclude the
wow64subsystem, which can trigger this legitimately through Heaven’s Gate. -
The Query:
index="main" CallTrace=" *UNKNOWN* " SourceImage!=" *Microsoft.NET* " CallTrace!= *ni.dll* CallTrace!= *clr.dll* CallTrace!= *wow64* | where SourceImage!=TargetImage | stats count by SourceImage
Filter 4: Explorer
-
The Pivot: Exclude noisy
Explorer.exewildcard matches after the prior filters. -
The Query:
index="main" CallTrace=" *UNKNOWN* " SourceImage!=" *Microsoft.NET* " CallTrace!= *ni.dll* CallTrace!= *clr.dll* CallTrace!= *wow64* SourceImage!="C:\Windows\Explorer.EXE" | where SourceImage!=TargetImage | stats count by SourceImage, TargetImage, CallTrace
Step 10: Think Like an Attacker (Alert Evasion)
-
The Pivot: After tuning the alert down from 1,575 hits, review how an attacker could evade the remaining logic.
-
The Discovery: Because we explicitly filtered out the string
*ni.dll*to silence C# noise, an attacker could bypass this alert by renaming a payload or loading a random DLL with “NI” in the name. Defenders must continually update and innovate their alerts to catch evasive TTPs. So its about iteration and enhancement and always thinking one step ahead.
Detecting Attacker Behavior: Spotting Known TTPs
After the full attack chain walkthrough, the module split detection into two styles. The first was Spot the Known: write searches around behaviors you already recognize (recon, PsExec, archives, odd ports, and similar TTPs).
Scenario 1: Detecting Reconnaissance (Living off the Land)
Attackers frequently use native Windows binaries (like net.exe or whoami.exe) to map the network and find privilege escalation opportunities without triggering antivirus alarms.
-
The Pivot: Use Sysmon Event ID 1 (Process Creation) to spot native mapping tools abused for reconnaissance.
-
The Query:
index="main" sourcetype="WinEventLog:Sysmon" EventCode=1 Image= *\ipconfig.exe OR Image=* \net.exe OR Image= *\whoami.exe OR Image=* \netstat.exe OR Image= *\nbtstat.exe OR Image=* \hostname.exe OR Image=*\tasklist.exe | stats count by Image,CommandLine | sort - count
- The Discovery: This search outputs the executable paths and command lines, highlighting when native binaries are being abused for reconnaissance.
Scenario 2: Catching Payloads on Whitelisted Domains
To bypass company proxies, attackers often host their malicious payloads on reputable, whitelisted domains like githubusercontent.com.
-
The Pivot: Use Sysmon Event ID 22 (DNS Query) to see which processes request whitelisted GitHub domains.
-
The Query:
index="main" sourcetype="WinEventLog:Sysmon" EventCode=22 QueryName=" *github* " | stats count by Image, QueryName
- The Discovery: This highlights unexpected background processes (like PowerShell or
svchost.exe) reaching out to GitHub, indicating a tool or payload download.
Scenario 3: Exposing Lateral Movement (PsExec)
PsExec is a potent system admin tool that allows users to run commands on remote systems, often under the highest NT AUTHORITY\SYSTEM account. Attackers love it for lateral movement. It works by copying a service executable to a hidden admin share, modifying the registry, and using named pipes to communicate.
We can detect this using three different Sysmon Event IDs:
Query A: Registry Modifications (Event 13)
-
The Pivot: PsExec modifies service
ImagePathvalues throughservices.exe. Userexto extract the file name cleanly. -
The Query:
index="main" sourcetype="WinEventLog:Sysmon" EventCode=13 Image="C:\\Windows\\system32\\services.exe" TargetObject="HKLM\\System\\CurrentControlSet\\Services\\*\\ImagePath" | rex field=Details "(?<reg_file_name>[^\\\]+)$ " | eval reg_file_name = lower(reg_file_name), file_name = if(isnull(file_name),reg_file_name,lower(file_name)) | stats values(Image) AS Image, values(Details) AS RegistryDetails, values(_time) AS EventTimes, count by file_name, ComputerName
- The Discovery: Surfaces suspicious service image paths associated with PsExec-style lateral movement.
Phew phew Regex i am having hard time on it too just understood basics but its now on my list to atleast learn basics

Query B: File Creation (Event 11)
-
The Pivot: PsExec drops a service executable through the
Systemimage. Pivot into Event 11 file creates. -
The Query:
index="main" sourcetype="WinEventLog:Sysmon" EventCode=11 Image=System | stats count by TargetFilename
- The Discovery: Highlights suspicious files created under the
Systemcontext.
Query C: Named Pipes (Event 18)
-
The Pivot: PsExec communicates over named pipes created by
System. Pivot into Event 18 pipe creation. -
The Query:
index="main" sourcetype="WinEventLog:Sysmon" EventCode=18 Image=System | stats count by PipeName
- The Discovery: Named pipe patterns here are a strong PsExec execution indicator.
Scenario 4: Data Exfiltration via Archive Files
Attackers compress data into archive files (like .zip or .7z) before transferring it out of the network.
-
The Pivot: Search EventCode 11 file creates for common archive extensions before data leaves the network.
-
The Query:
index="main" EventCode=11 (TargetFilename=" *.zip" OR TargetFilename="* .rar" OR TargetFilename="*.7z") | stats count by ComputerName, User, TargetFilename | sort - count
- The Discovery: Surfaces archive staging activity grouped by user and host for exfil review.
Scenario 5: Drive-By Downloads (PowerShell & MS Edge)
Attackers use PowerShell to fetch tools silently, or deceive users into downloading malware via their web browsers.
- The Pivot: When a file is downloaded from the internet, Windows tags it with a
Zone.IdentifierADS. Track that alongside PowerShell or Edge downloads.
PowerShell download pivot
- The Query:
index="main" sourcetype="WinEventLog:Sysmon" EventCode=11 Image=" *powershell.exe* " | stats count by Image, TargetFilename | sort + count
- The Discovery: Shows files written by PowerShell that may be silently staged tooling.
MS Edge and Zone.Identifier pivot
- The Query:
index="main" sourcetype="WinEventLog:Sysmon" EventCode=11 Image=" *msedge.exe" TargetFilename=* "Zone.Identifier" | stats count by TargetFilename | sort + count
- The Discovery: Highlights browser downloads marked as internet-origin files.
Scenario 6: Execution from Atypical Locations
Malware is frequently executed directly from the user’s Downloads folder, which is atypical for legitimate enterprise software.
-
The Pivot: Use regex on EventCode 1 to find executions happening strictly inside
\Downloads\. -
The Query:
index="main" EventCode=1 | regex Image="C:\\Users\\.* \\Downloads\\.*" | stats count by Image
- The Discovery: Surfaces binaries run directly from user download folders.
Scenario 7: Rogue Binaries Outside the Windows Directory
Legitimate system executables belong in specific protected folders. Malware often drops .exe or .dll files outside of the standard Windows directories.
-
The Pivot: Search EventCode 11 for
.exeand.dllfile creates outside*\windows\*. -
The Query:
index="main" EventCode=11 (TargetFilename=" *.exe" OR TargetFilename="* .dll") TargetFilename!=" *\windows\* " | stats count by User, TargetFilename | sort + count
- The Discovery: Highlights dropped binaries in non-standard locations.
Scenario 8: Misspelled Legitimate Binaries (Evasion)
Attackers try to hide by intentionally misspelling legitimate binaries (e.g., naming their malware psexe.exe instead of the legitimate PSEXESVC.exe).
-
The Pivot: Hunt misspelled
psexevariants across command line, parent command line, parent image, and image while excluding legitimate PsExec binaries. -
The Query:
index="main" sourcetype="WinEventLog:Sysmon" EventCode=1 (CommandLine=" *psexe* .exe" NOT (CommandLine="*PSEXESVC.exe" OR CommandLine="*PsExec64.exe")) OR (ParentCommandLine=" *psexe* .exe" NOT (ParentCommandLine="*PSEXESVC.exe" OR ParentCommandLine="*PsExec64.exe")) OR (ParentImage=" *psexe* .exe" NOT (ParentImage="*PSEXESVC.exe" OR ParentImage="*PsExec64.exe")) OR (Image=" *psexe* .exe" NOT (Image="*PSEXESVC.exe" OR Image="*PsExec64.exe")) | table Image, CommandLine, ParentImage, ParentCommandLine
- The Discovery: Catches typosquatted PsExec-style binaries used for evasion.
Scenario 9: Using Non-Standard Network Ports
Attackers often use non-standard ports to transfer tools or communicate with command-and-control servers.
-
The Pivot: Monitor EventCode 3 network connections while excluding common web and file transfer ports (80, 443, 22, 21).
-
The Query:
index="main" EventCode=3 NOT (DestinationPort=80 OR DestinationPort=443 OR DestinationPort=22 OR DestinationPort=21) | stats count by SourceIp, DestinationIp, DestinationPort | sort - count
- The Discovery: Surfaces tool transfers and C2 traffic on non-standard ports.
Known TTP searches are precise, but an attacker can rename a binary or change a port and slip past them. The module then moved into Spot the Unusual. I am not great at the maths side of it, but the idea clicked once I saw it on real Sysmon data.
Statistical Anomaly Detection: Spot the Unusual
Instead of hunting a specific malicious string, these searches baseline normal behavior and flag drift with streamstats, eventstats, and transaction.
Scenario 1: Uncovering Network Beacons & Data Exfiltration
Malware often communicates with Command and Control (C2) servers or exfiltrates data, causing an unusual spike in network connections.
-
The Pivot: Baseline Sysmon Event ID 3 per process with 1-hour buckets, then flag connection volume more than 0.5 standard deviations above a 24-hour rolling average.
-
The Query:
index="main" sourcetype="WinEventLog:Sysmon" EventCode=3 | bin _time span=1h | stats count as NetworkConnections by _time, Image | streamstats time_window=24h avg(NetworkConnections) as avg stdev(NetworkConnections) as stdev by Image | eval isOutlier=if(NetworkConnections > (avg + (0.5*stdev)), 1, 0) | search isOutlier=1
- The Discovery: This isolates statistically anomalous network activity, instantly highlighting processes that have suddenly started communicating heavily over the network.
Scenario 2: Catching Obfuscated and Abnormally Long Commands
Attackers frequently employ excessively long, obfuscated command lines to execute malicious scripts or bypass security filters.
-
The Pivot: Instead of hunting specific keywords, measure
cmd.execommand-line length witheval, filter noisy parents, and sort longest first. -
The Query:
index="main" sourcetype="WinEventLog:Sysmon" Image=*cmd.exe ParentImage!="*msiexec.exe" ParentImage!="*explorer.exe" | eval len=len(CommandLine) | table User, len, CommandLine | sort - len
- The Discovery: Reviewing the longest commands easily exposes hidden, heavily encoded malicious operations.
Scenario 3: Spikes in Command-Line Activity
Sometimes the command itself isn’t anomalous, but the frequency is. A sudden burst of cmd.exe executions could indicate an automated malicious script running.
-
The Pivot: Bucket
cmd.exeexecutions into 1-hour windows and flag hours that spike 1.5 standard deviations above the norm. -
The Query:
index="main" EventCode=1 (CommandLine=" *cmd.exe* ") | bucket _time span=1h | stats count as cmdCount by _time User CommandLine | eventstats avg(cmdCount) as avg stdev(cmdCount) as stdev | eval isOutlier=if(cmdCount > avg+1.5*stdev, 1, 0) | search isOutlier=1
- The Discovery: Surfaces bursts of command execution that may indicate automated malicious scripting.
Scenario 4: Malware Unpacking (Rapid DLL Loading)
It is highly common for malware to unpack itself and load multiple different DLLs in rapid succession to execute its payload.
-
The Pivot: Track Sysmon Event ID 7 with
dc(ImageLoaded)per process per hour, filter normal Windows paths, and flag more than 3 unique DLL loads. -
The Query:
index="main" EventCode=7 NOT (Image="C:\Windows\System32*") NOT (Image="C:\Program Files (x86) *") NOT (Image="C:\Program Files* ") NOT (Image="C:\ProgramData*") NOT (Image="C:\Users\waldo\AppData*") | bucket _time span=1h | stats dc(ImageLoaded) as unique_dlls_loaded by _time, Image | where unique_dlls_loaded > 3 | stats count by Image, unique_dlls_loaded | sort - unique_dlls_loaded
- The Discovery: This quickly surfaces suspicious processes exhibiting unpacking or injection behaviors. (Note: Some legitimate software acts this way, so context is required).
Scenario 5: Correlating Duplicate Process Executions
If the exact same process is executed repeatedly on the same computer, it can indicate malicious persistence mechanisms or process injection.
-
The Pivot: Use
transactionon Event Code 1 grouped byComputerNameandImage, then keep only rows with more than one unique Process GUID. -
The Query:
index="main" sourcetype="WinEventLog:Sysmon" EventCode=1 | transaction ComputerName, Image | where mvcount(ProcessGuid) > 1 | stats count by Image, ParentImage
-
The Discovery: If this reveals suspicious pairings such as
rundll32.exerepeatedly spawning fromsvchost.exe, pivot again into command lines to verify the intrusion. -
Follow-up pivot: Extract exact command lines for the suspicious parent-child pair.
-
Follow-up query:
index="main" sourcetype="WinEventLog:Sysmon" EventCode=1 | transaction ComputerName, Image | where mvcount(ProcessGuid) > 1 | search Image="C:\Windows\System32\rundll32.exe" ParentImage="C:\Windows\System32\svchost.exe" | table CommandLine, ParentCommandLine
Too many queries too many scenarios but I learnt a lot in this module and yes.
Threat hunting in a massive environment is not about writing a single perfect query; it is about building a layered defense. By establishing a profile of normal behavior and utilizing statistical models to identify deviations, you can detect compromises much more rapidly.
The most successful security teams combine the precision of “Spot the Known” (TTP monitoring) with the broad, dynamic safety net of “Spot the Unusual” (Anomaly analysis) to ensure that no matter how an attacker maneuvers, they leave a measurable trace in the logs.
Key Takeaway
Splunk hunting at scale is less about memorizing every SPL command and more about knowing what to pivot on next. The module walked architecture and SPL first, then showed how one finding should lead to the next question across a large dataset.
What stuck with me:
- Know your indexes, sourcetypes, and fields before writing long searches.
- Target specific fields instead of broad wildcard regex across everything.
- One discovery should open the next pivot (parent-child, IP, auth event, call trace).
- Spot the Known catches familiar TTPs; Spot the Unusual catches behavior that changed.
- A detection idea is not done until you filter noise and think about how an attacker would evade it.
I consolidated the practical exercise queries on this page, and I am building them out in spl-threat-hunting-library so they are easier to reference and reuse later.
Where AI Can Help
I used Claude Code as an assistant while working through this module, mainly for generating SPL query drafts and thinking through the next pivot when I got stuck on a hunt step.
What it helped with:
- First-pass SPL for longer searches (
rex,streamstats,transaction, alert tuning). - Suggesting what to pivot on after a discovery (for example, IP to sourcetype, injector to child processes).
- Cleaning up rough query notes into something I could paste into Splunk and test.
What I still had to do myself:
- Run every query against the real dataset and confirm field names.
- Decide whether the output actually answered the question.
- Own the hunt logic and the final call on what was suspicious.
Same balance as Module 3: AI speeds up the draft and the pivot ideas, but the analyst still owns the evidence.
References
[HTB Academy] Certified Defensive Security Analyst (CDSA) - Module 4: Understanding Log Sources & Investigating with Splunk. https://academy.hackthebox.com/
[spl-threat-hunting-library] Environment-agnostic Splunk SPL threat-hunting queries from CDSA Module 4, organized by attacker phase. https://github.com/kismatkunwar89/spl-threat-hunting-library
[SwiftOnSecurity] sysmon-config (Sysmon configuration baseline referenced across hunting scenarios). https://github.com/SwiftOnSecurity/sysmon-config
Skill Assessment and Additional Queries
The module notes above are the reference material. The skill assessment and the extra searches I ran afterward are where I applied the same pivot habit to specific questions.
- Module 4: Skill Assessment: process injection through CreateRemoteThread, parent-child pivots, and EventCode breadth analysis
- Module 4: Additional Splunk Hunting Queries: remote thread baselines, PsExec password recovery, C2 inbound ports, Kerberos volume, and burst login windows